
GIS automation
TAKEPOINT: Spatial Intelligence From First Take to Last
Well-location validation, drainage overlap analysis, and production-water pond detection in the Midland Basin, Texas.
- Role
- Project manager and GIS analyst
- Project
- TakePoint / Enverus capstone
My contribution
Sanaz Poroushani — Project manager and GIS analyst. I developed the complete Objective 1 Python/ArcPy workflow, including OCR-record cleaning and label standardization, coordinate-system identification and conversion, spatial correction, point-to-reference validation, and generation of validated producing intervals.
I also developed Objective 2, Parts C and D: measuring overlap between existing and future well drainage footprints, calculating overlap fractions, adjusting forecast production values, and ranking future wells. Across the project, I was involved in all research and QA/QC activities, map creation, and development and refinement of the Experience Builder application.
The case study below follows the team poster’s narrative across all three objectives.
01 / Introduction
Overview
TAKEPOINT is an applied GIS project developed to support well-location accuracy, infill planning, and surface-feature analysis in the Midland Basin. The project combines historical plat information, Enverus well and development data, spatial analysis, and remote sensing to create a flexible and repeatable workflow for evaluating both subsurface and surface conditions. Objective 1 extracts and validates well survey points from scanned plats, converts coordinates to a common reference system, and produces reliable FTP–LTP producing intervals (see Key Terms). Objective 2 uses validated intervals to model drainage footprints, measure overlap with future placed wells, adjust forecast EUR, and identify open rock with greater remaining development potential. Objective 3 extends the analysis to the surface by using satellite imagery and raster-based water detection to identify likely production water ponds. Together, the three objectives create an integrated spatial framework for improving data reliability and supporting more informed and strategically aligned future development decisions.
Geographic QuestionCan regulatory plat documents locate wells accurately enough to map which rock has been drained in the Midland Basin, and if so, where does undrained value remain?
Objectives
- Identify correct well point locations from OCR results by filtering detrimental data inaccuracies, shifting & rotating points, and performing QA/QC validations
- Determine overlapping area between existing and future well laterals to forecast EUR
- Extract production water ponds from PlanetScope imagery of Martin County
Study Area
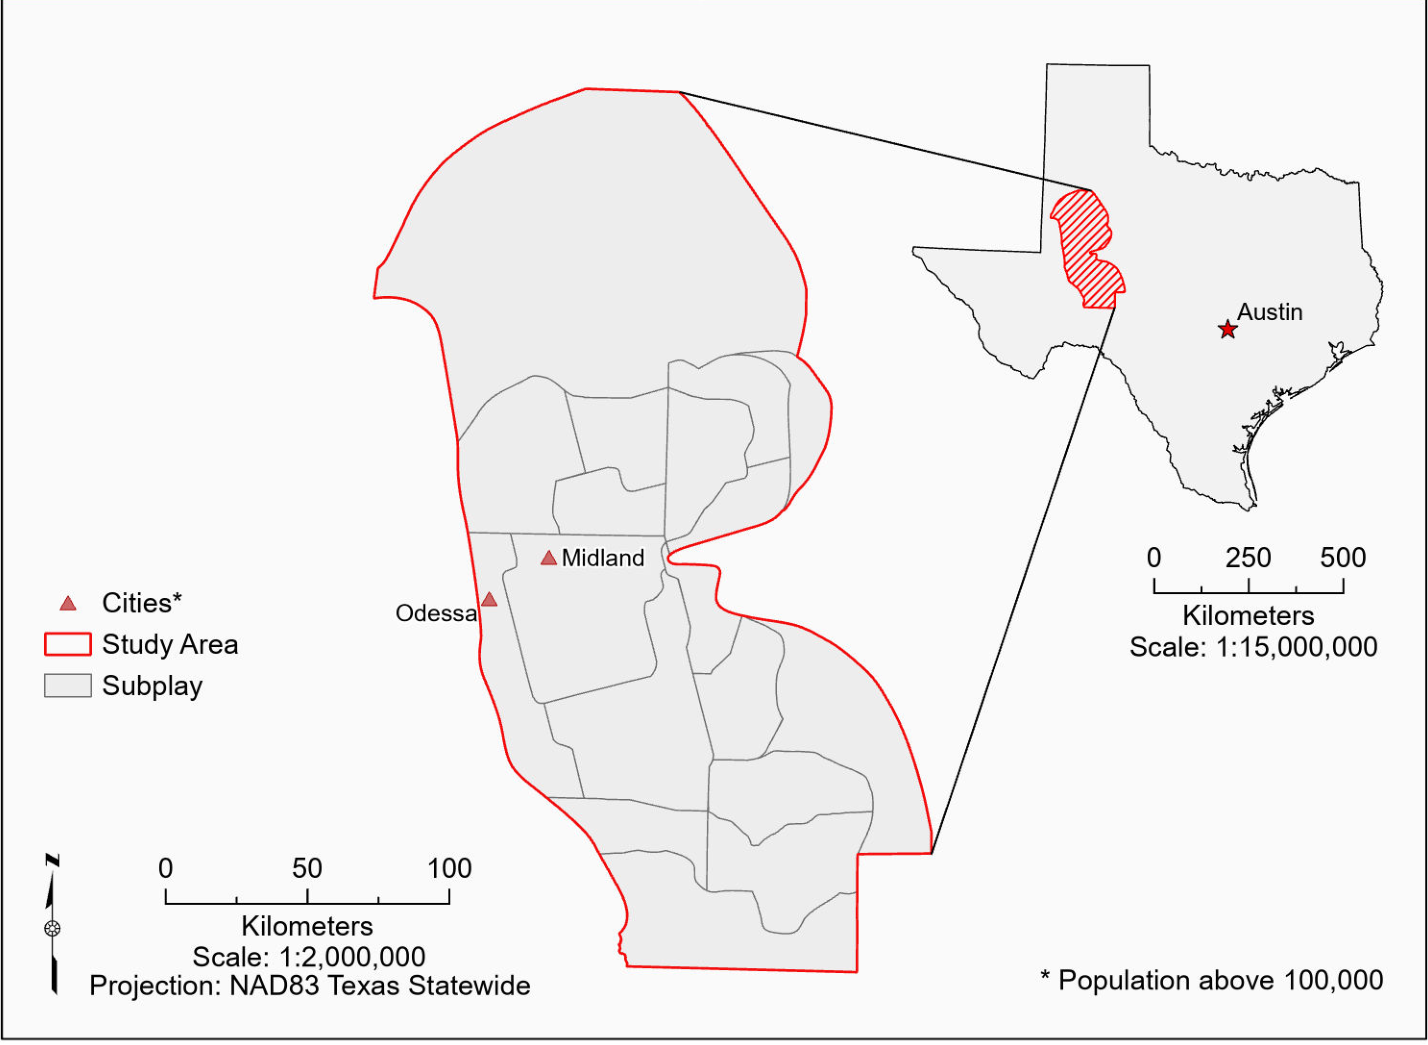
The study area, the Midland Basin of Texas, is approximately 318 miles or 512 kilometers West of Austin. The Midland Basin is further separated into Subplay divisions.
Stakeholders
- Benefit Enverus by automating well point extraction from oil and gas plats
- Providing the oil and gas industry with improved drilling analysis
- Demonstrating to the GIS industry how OCR and GIS can transform non-spatial documents into valuable spatial datasets
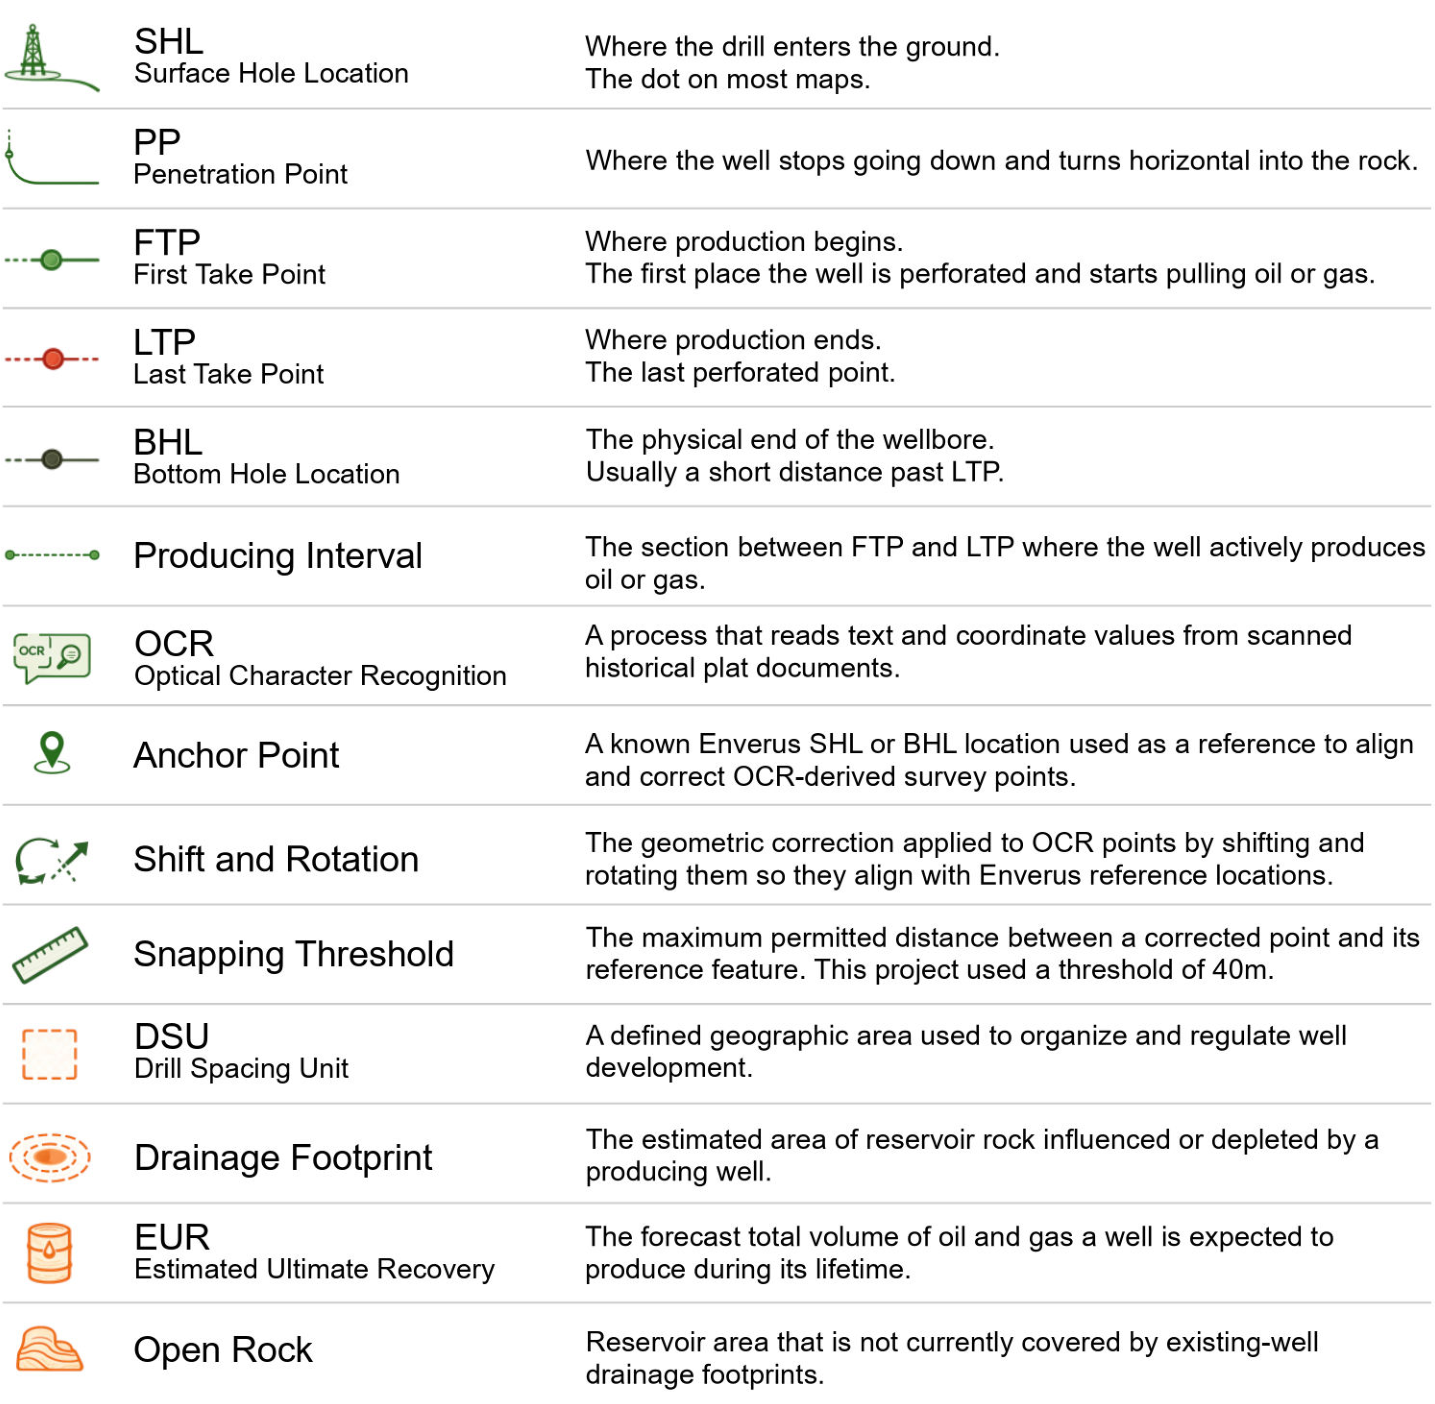
Key Terms — original poster glossary
02 / Methodology & Analysis · Objective 1
Well Points Coordinate Conversion, Shift & Rotation
My work: complete Objective 1 workflow.

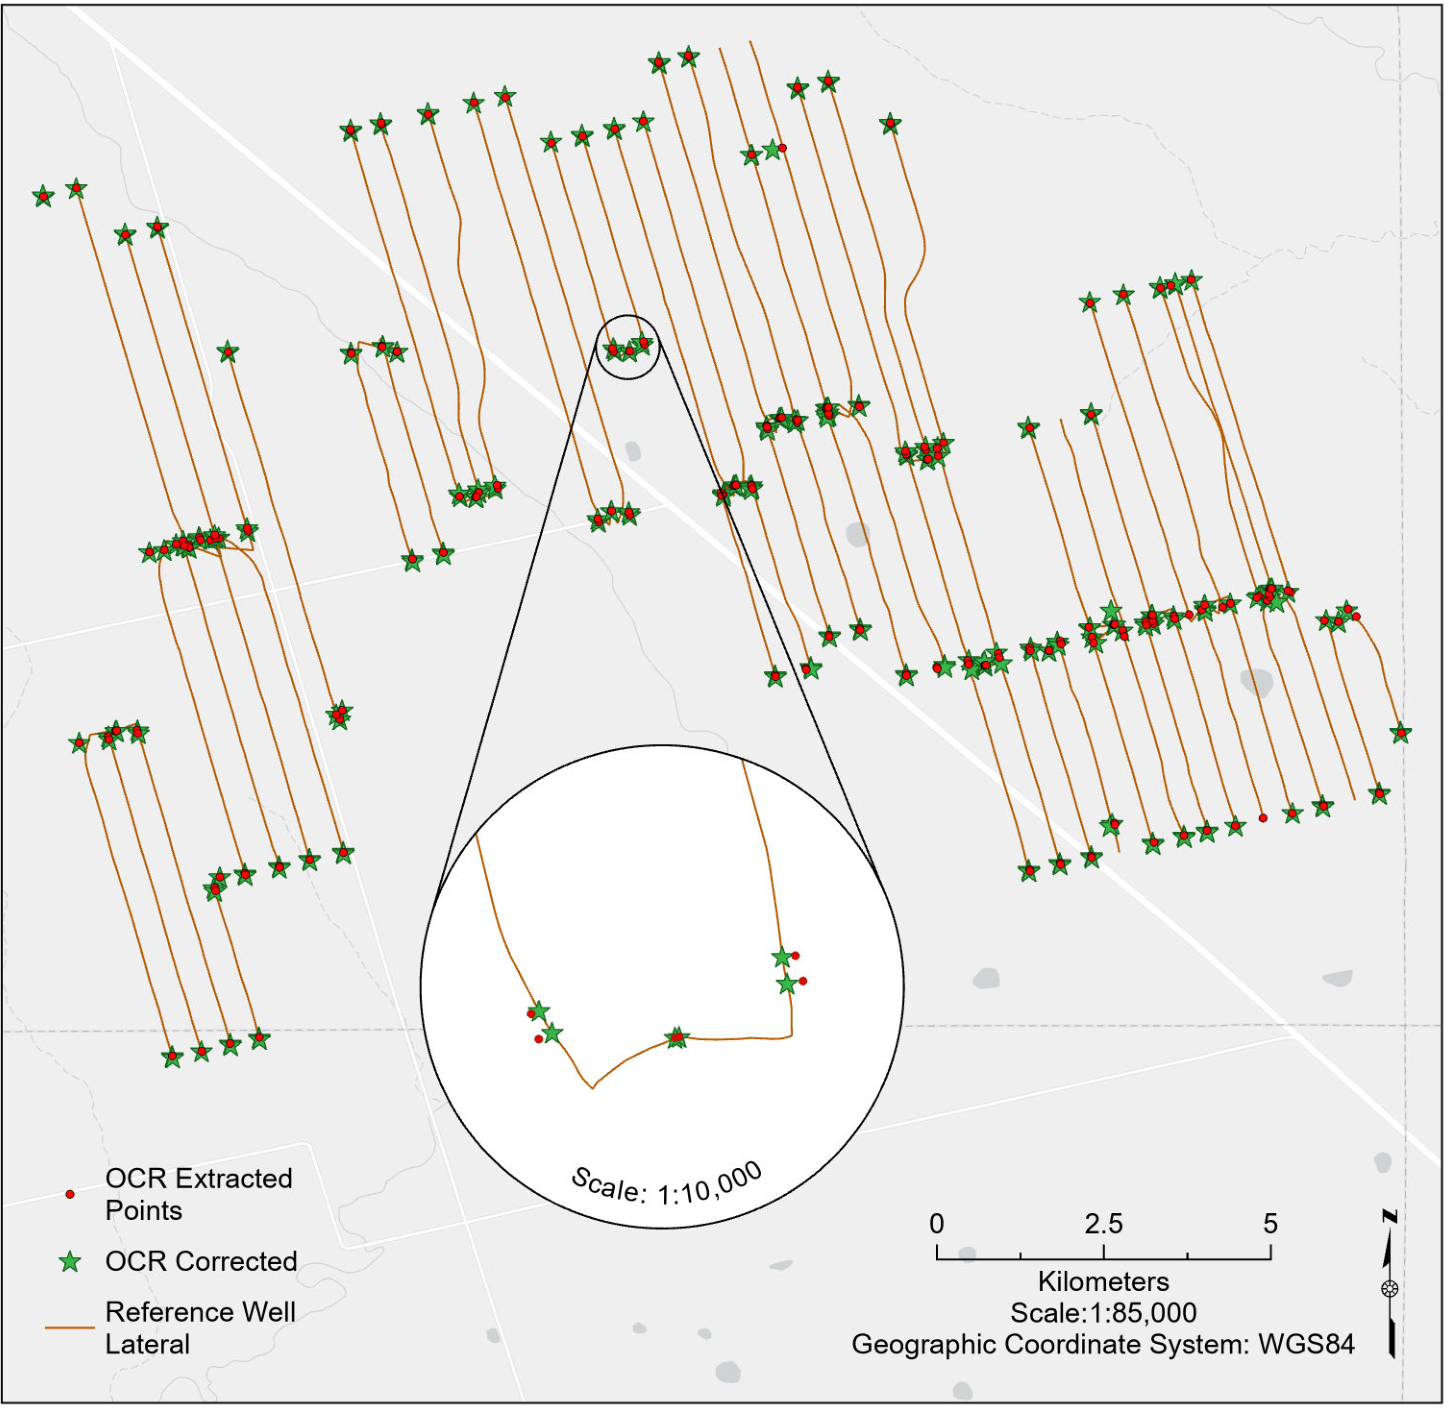
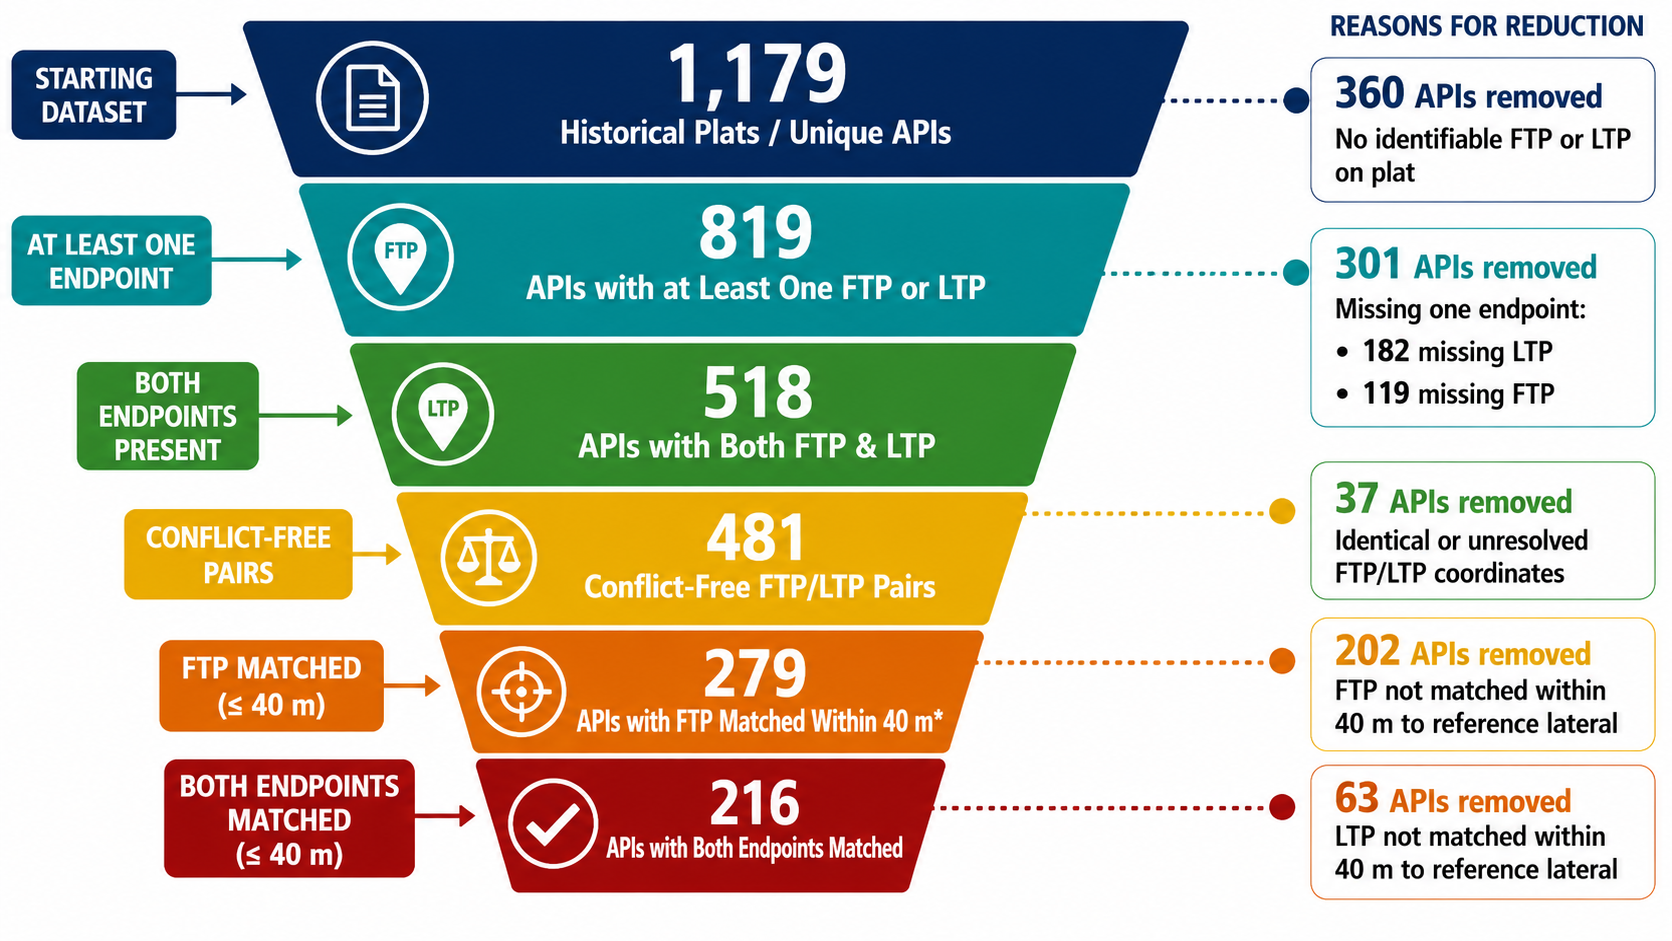
Objective 1 focused on converting OCR-extracted coordinates from scanned historical well plats into reliable survey-point locations. The OCR results contained several quality issues, including low-confidence values, incorrect or inconsistent point labels, repeated coordinates, missing FTP or LTP endpoints, uncertain coordinate systems, and cases where FTP and LTP were assigned the same location. To address these issues, the workflow filtered records using a 90% confidence threshold, standardized labels for SHL, PP, FTP, LTP, and BHL, identified the correct NAD27 Texas State Plane zone, and converted retained coordinates to WGS84. The points were then spatially corrected using Enverus SHL and BHL reference locations, while FTP and LTP were validated against the matching well lateral using a 40 m threshold. This process produced 3,195 retained survey points and 216 validated FTP–LTP interval lines.
Objective 1 / Code spotlight
Rotation and translation
This verbatim excerpt from my Objective01.py script applies rotation and translation to a survey point. As specified in the function, scale is not applied. It uses helpers, parameters, and the projected spatial reference defined elsewhere in the script.
View original Python / ArcPy excerpt
    def transform_point_two_point(point_geom, params):
        """
        Apply rotation + translation for either two-point or one-point parameters.
        Scale is NOT applied.
        """
        xy = point_xy(point_geom)

        if xy is None:
            return None

        x = xy[0]
        y = xy[1]

        # Convert point to local coordinates relative to OCR SHL.
        local_x = x - params["ocr_shl_x"]
        local_y = y - params["ocr_shl_y"]

        angle = params["rotation_rad"]

        # Rotate local coordinates.
        rotated_x = local_x * math.cos(angle) - local_y * math.sin(angle)
        rotated_y = local_x * math.sin(angle) + local_y * math.cos(angle)

        # Translate to Enverus SHL.
        corrected_x = params["env_shl_x"] + rotated_x
        corrected_y = params["env_shl_y"] + rotated_y

        corrected_geom = arcpy.PointGeometry(
            arcpy.Point(corrected_x, corrected_y),
            sr_projected
        )

        return corrected_geom
03 / Methodology & Analysis · Objective 2
EUR Forecast Using Existing & Future Well Overlap Buffers
My work: Parts C and D — measuring overlap and scoring future wells.
Rock Layer Divisions
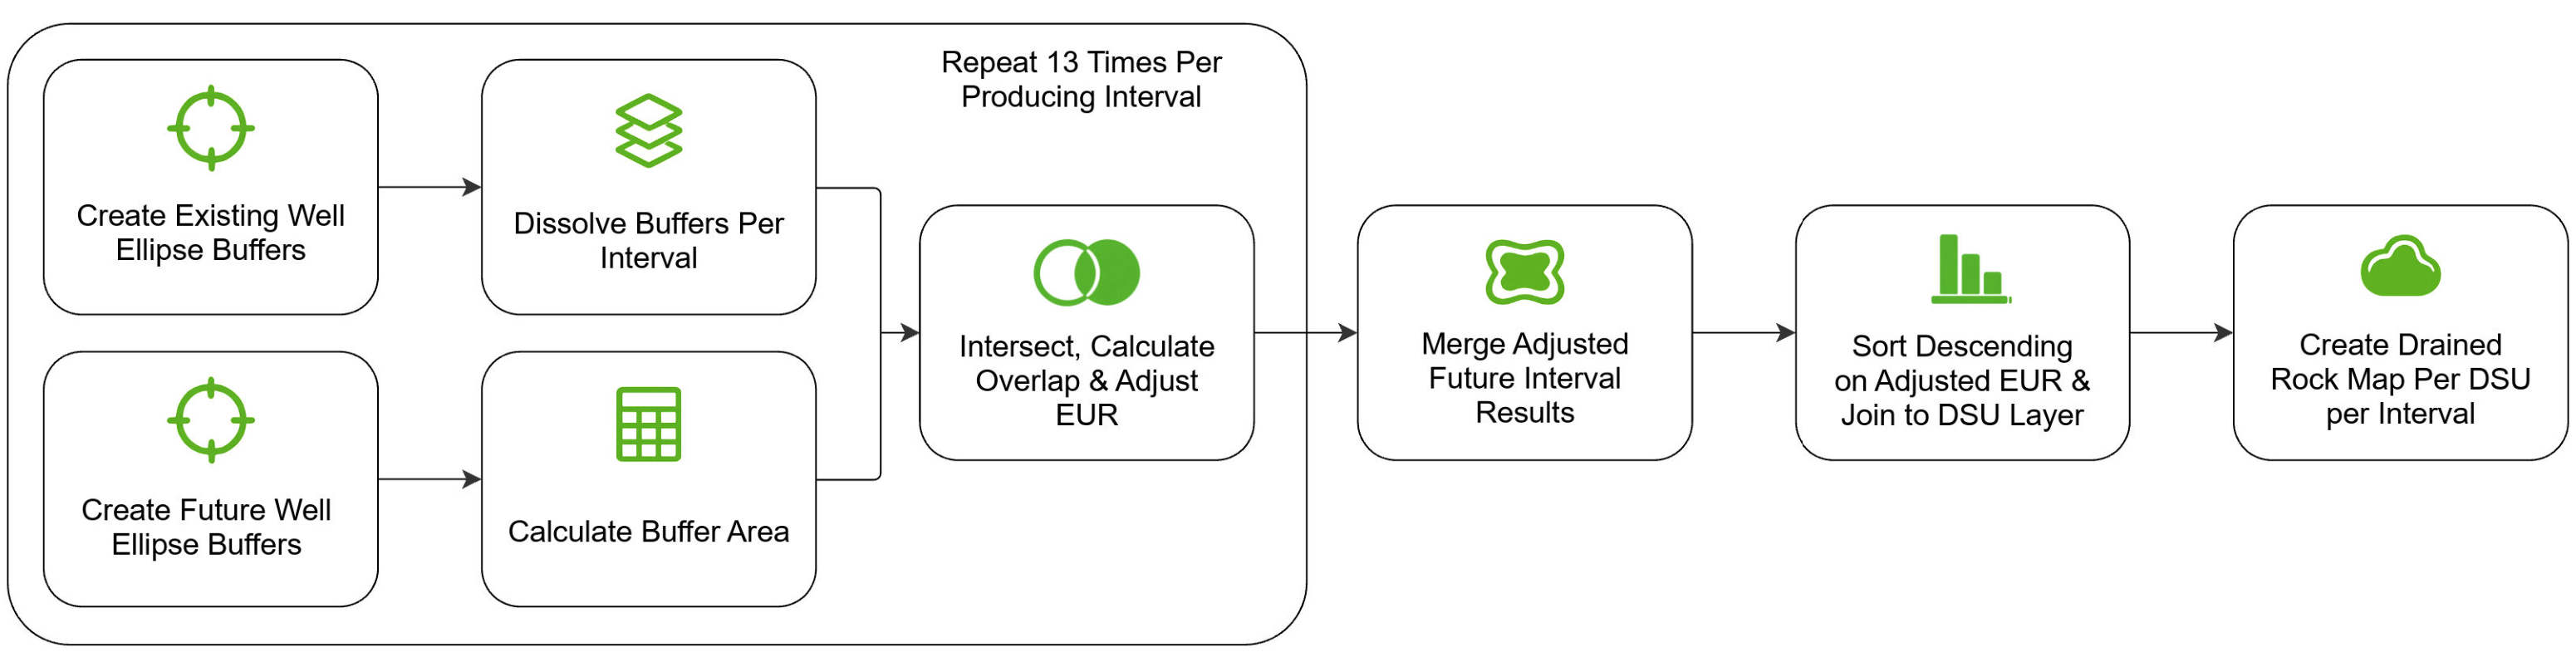
It is important to note that wells in different rock layers do not compete. Even if they appear to overlap at the same coordinate, they can be thousands of feet apart vertically. Since this is the case, we are dividing existing and future wells into thirteen rock layer divisions, and repeating the same calculations on them all separately.
Ellipse Buffers
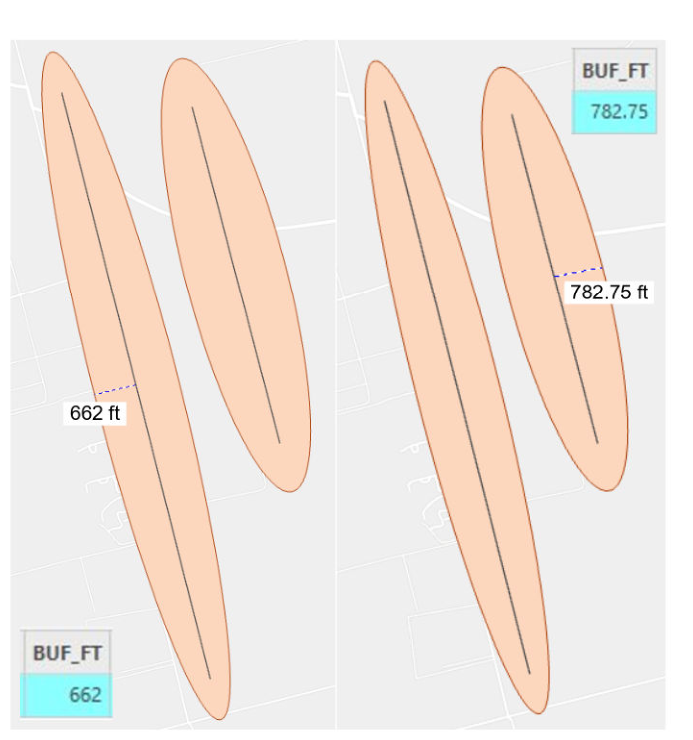
Using Enverus provided existing and future lateral lines, we created ellipse buffers for each lateral line using the half-width field ‘BUF_FT’. This allowed for more realistic simulation of well drainage in surrounding areas compared to having the default buffer shapes. The ellipse buffer shape was also specifically requested by Enverus, along with using the half-width buffer value to better suit the unique characteristics of each well lateral.
Intersecting Existing and Future Well Buffers
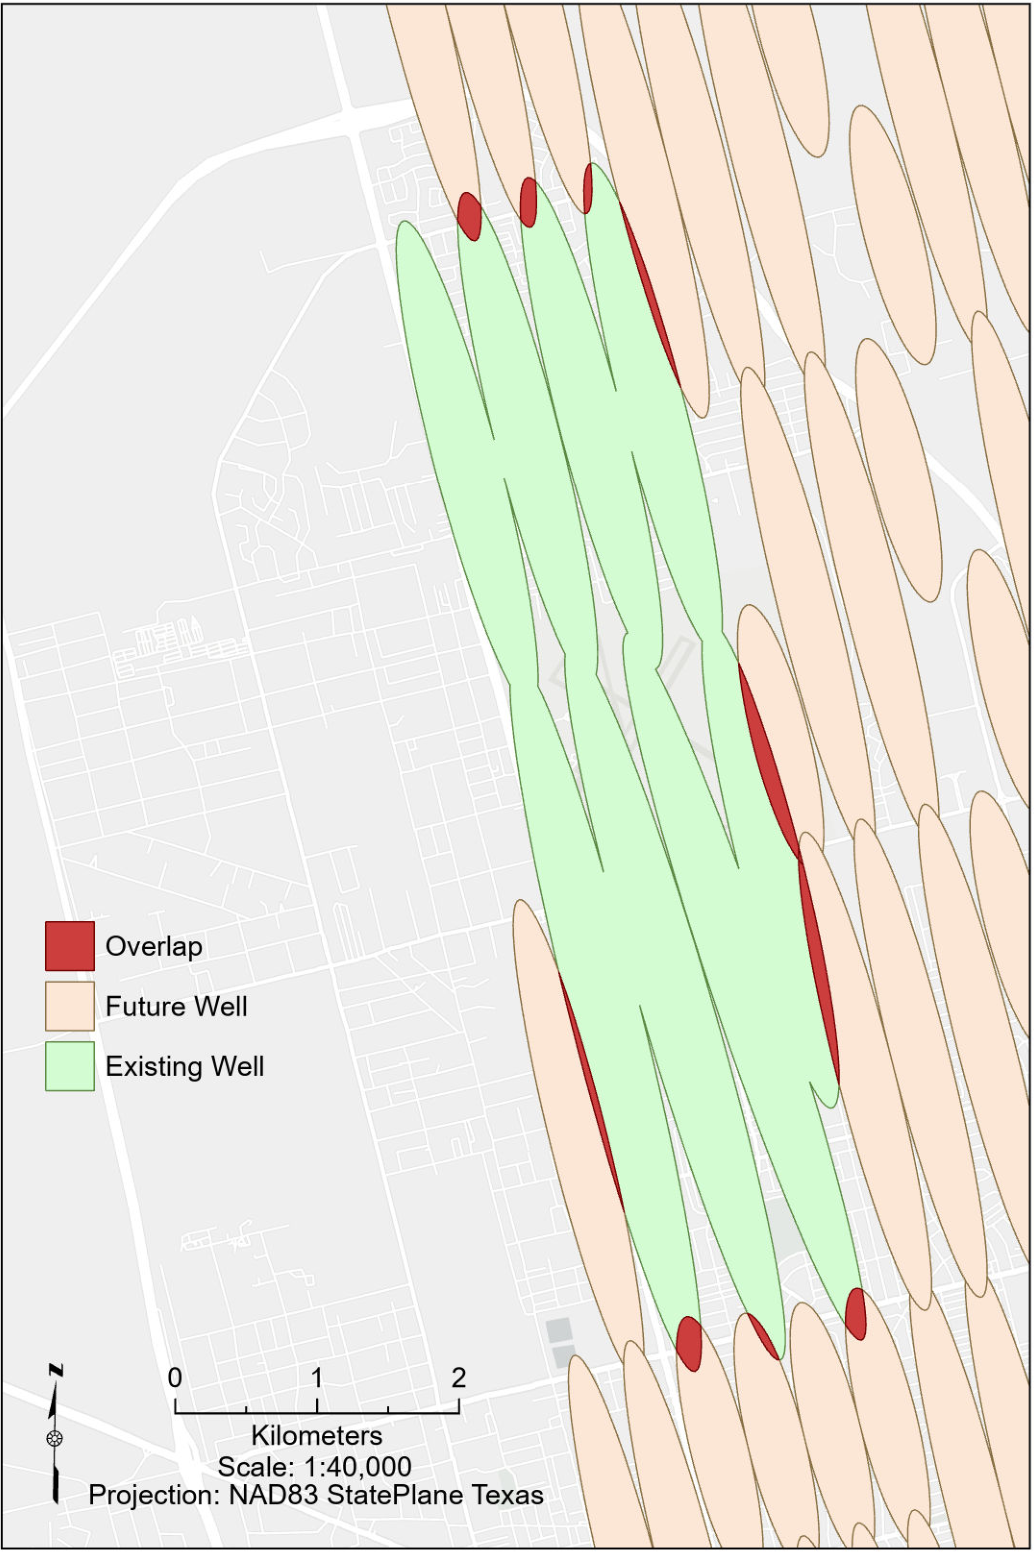
After creating the ellipse buffers for existing wells, we dissolved them. Then, created the same ellipse buffer type for future wells, this time not dissolving them, but performed calculations to find the total area of each buffer in square feet. Using the dissolved existing well buffers and the future well buffers, we intersected them to find the size of the overlapping area. Summary Statistics was used to sum the overlapping area for each plat.
Lastly, the summarized overlap is joined back to the future well buffers to interpret the Overlap fraction. The output values can be understood as followed: 0 representing No Interference, the future well buffer is entirely within open rock. 0.50 for Partial Interference, when half of the future well drainage area overlaps previously drained rock. And finally, with 1 standing for Full Interference, when the entire future well buffer overlaps previously drained rock.
Ranking Results & Open-Rock Map
Since the process up to this point has been repeated thirteen times, we have thirteen future well feature class outputs at this point. To rank the results, we merged the thirteen results into one layer and used descending order to sort by the adjusted EUR value while using the DSU_ID as case field. Then, joined the ranked results to the DSU layer. Finally, using Pairwise Erase between the DSU and drained polygons to create the open-rock map.
04 / Methodology & Concluding Remarks · Objective 3
Extract Production Water Ponds
Team project context.
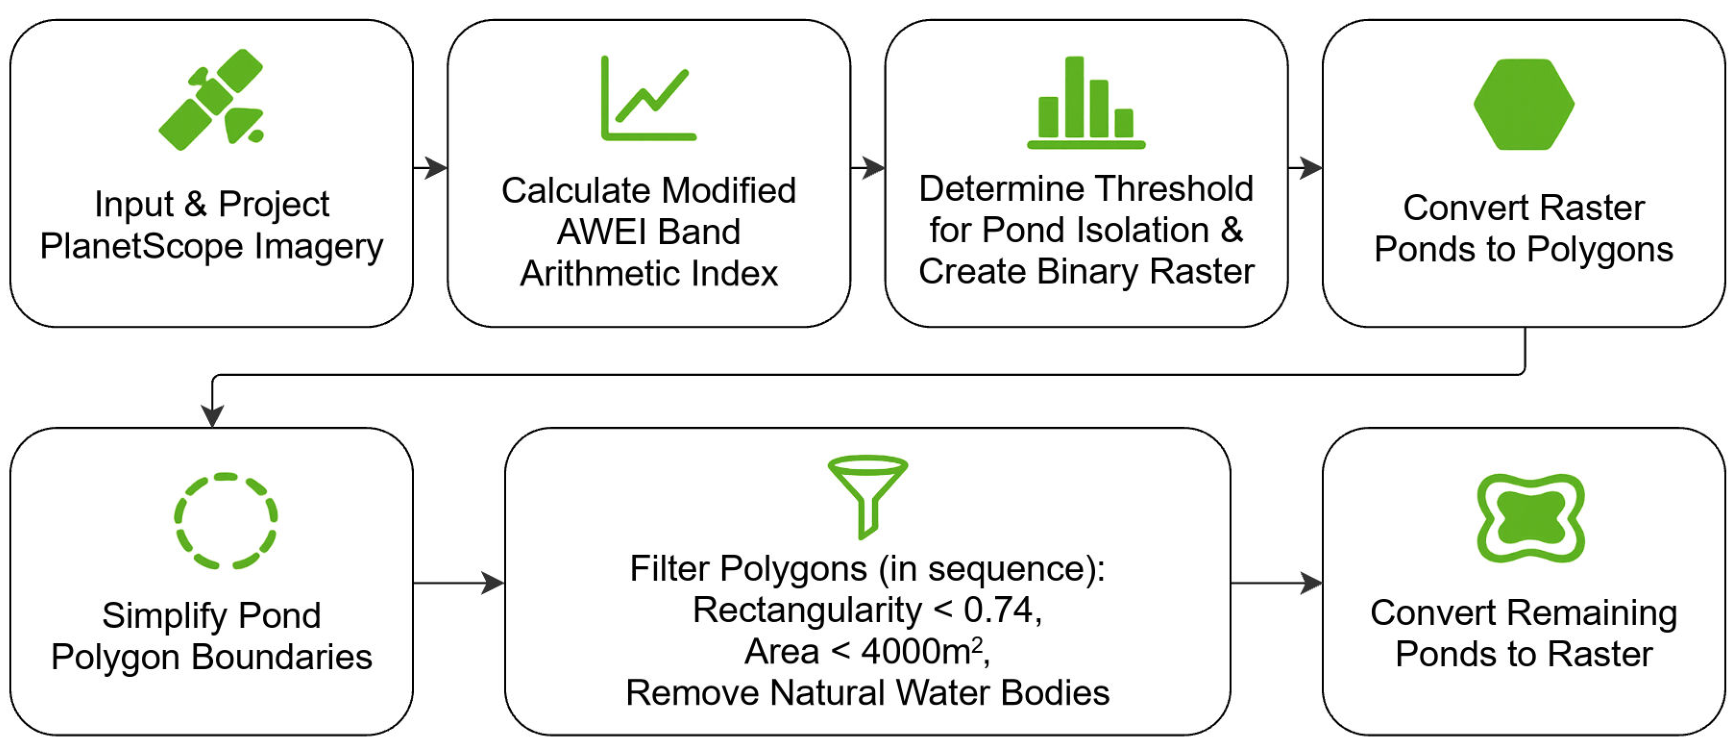
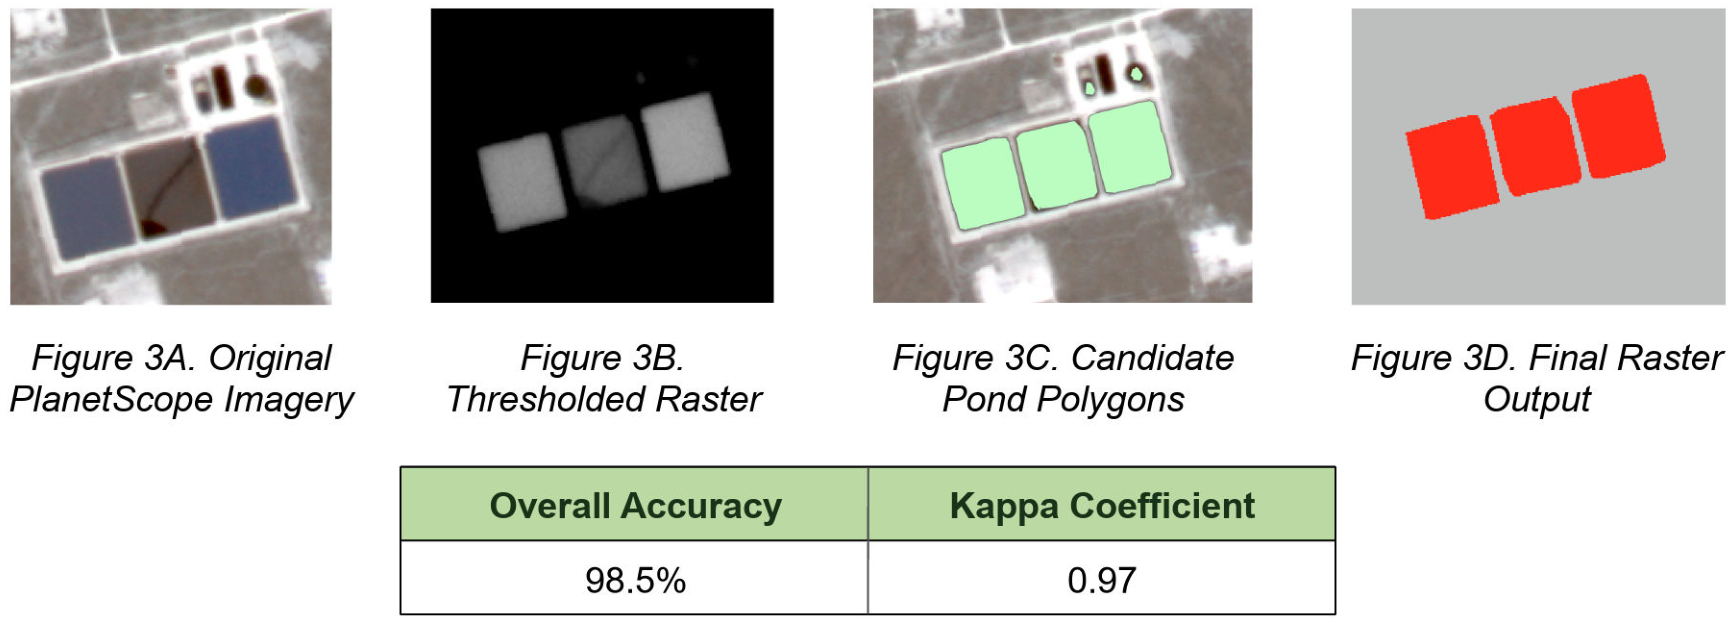
Production water ponds are critical water management infrastructure throughout the Midland Basin, yet manually identifying these features from satellite imagery is both time-consuming and inefficient. The developed workflow successfully identified production water ponds while minimizing false detections through spectral thresholding and geometric filtering, producing a repeatable method for mapping ponds from PlanetScope imagery.
The final raster was evaluated using 200 stratified random validation points (100 pond and 100 non-pond). The classification achieved an Overall Accuracy of 98.5% and a Kappa coefficient of 0.97, with the high accuracy attributed to geometric feature filtering and iterative manual threshold adjustment for the PlanetScope imagery used in this study.
A portion of the workflow was used to create a custom ArcGIS Pro geoprocessing tool for integration into the project’s ArcGIS Experience Builder application. The tool enables users to identify potential production water ponds from a precomputed pond index raster derived using the modified AWEI equation within a user-drawn analysis area using adjustable threshold, minimum area, and rectangularity parameters. Candidate features are further filtered by removing polygons that intersect known natural water features. This approach provides users with a simplified interface for applying and adjusting the developed pond detection methodology to selected areas of interest.
05 / Concluding remarks
Conclusion
The TAKEPOINT project demonstrated how GIS automation, spatial analysis, and remote sensing can support oil and gas development analysis in the Midland Basin.
Objective 1 improved historical plat data by extracting, validating, converting, and spatially correcting OCR-derived survey coordinates. Although source-data limitations reduced the number of fully validated producing intervals, the workflow provided a repeatable method for improving coordinate reliability and identifying problematic records.
Objective 2 used well laterals to model drainage footprints, measure spatial overlap between existing and future wells, adjust forecast EUR values based on interference, and identify areas of remaining open rock with greater development potential.
Objective 3 expanded the analysis to the surface by applying remote-sensing and raster-processing techniques to identify likely production-water ponds. Together, the three objectives produced repeatable GIS workflows for data validation, subsurface development analysis, and surface-feature detection, demonstrating how multiple geospatial techniques can be integrated to improve data quality and support more informed development decisions.
Recommendations
Future work should focus on improving the quality and consistency of the source data used in the OCR workflow. Higher-resolution plats, improved OCR models, stronger label recognition, and additional automated QA/QC checks could increase the number of reliable survey points and validated producing intervals. The workflow could also be expanded with more reference data to improve coordinate validation and reduce the amount of manual review required.
For the infill analysis, future studies could refine drainage-footprint dimensions by formation and incorporate additional production and spacing information to improve interference estimates. The production-water pond workflow could also be strengthened using higher-resolution imagery, multi-date analysis, and additional validation data to reduce false detections. Together, these improvements would make the TAKEPOINT workflows more scalable, accurate, and useful for future development planning.
Acknowledgements
We would like to thank Tigran Melkumyan and Jay Reid for their guidance throughout this project, and Ross Lindsay and Brad Lawrence for their collaboration, industry expertise, and support throughout our capstone. We also gratefully acknowledge Enverus for providing the data used in this project.
References — original poster bibliography

06 / Project poster
The complete team poster
TAKEPOINT: Spatial Intelligence From First Take to Last
Sanaz Poroushani, Yi Han Wei, Cassandra Crosby
View original poster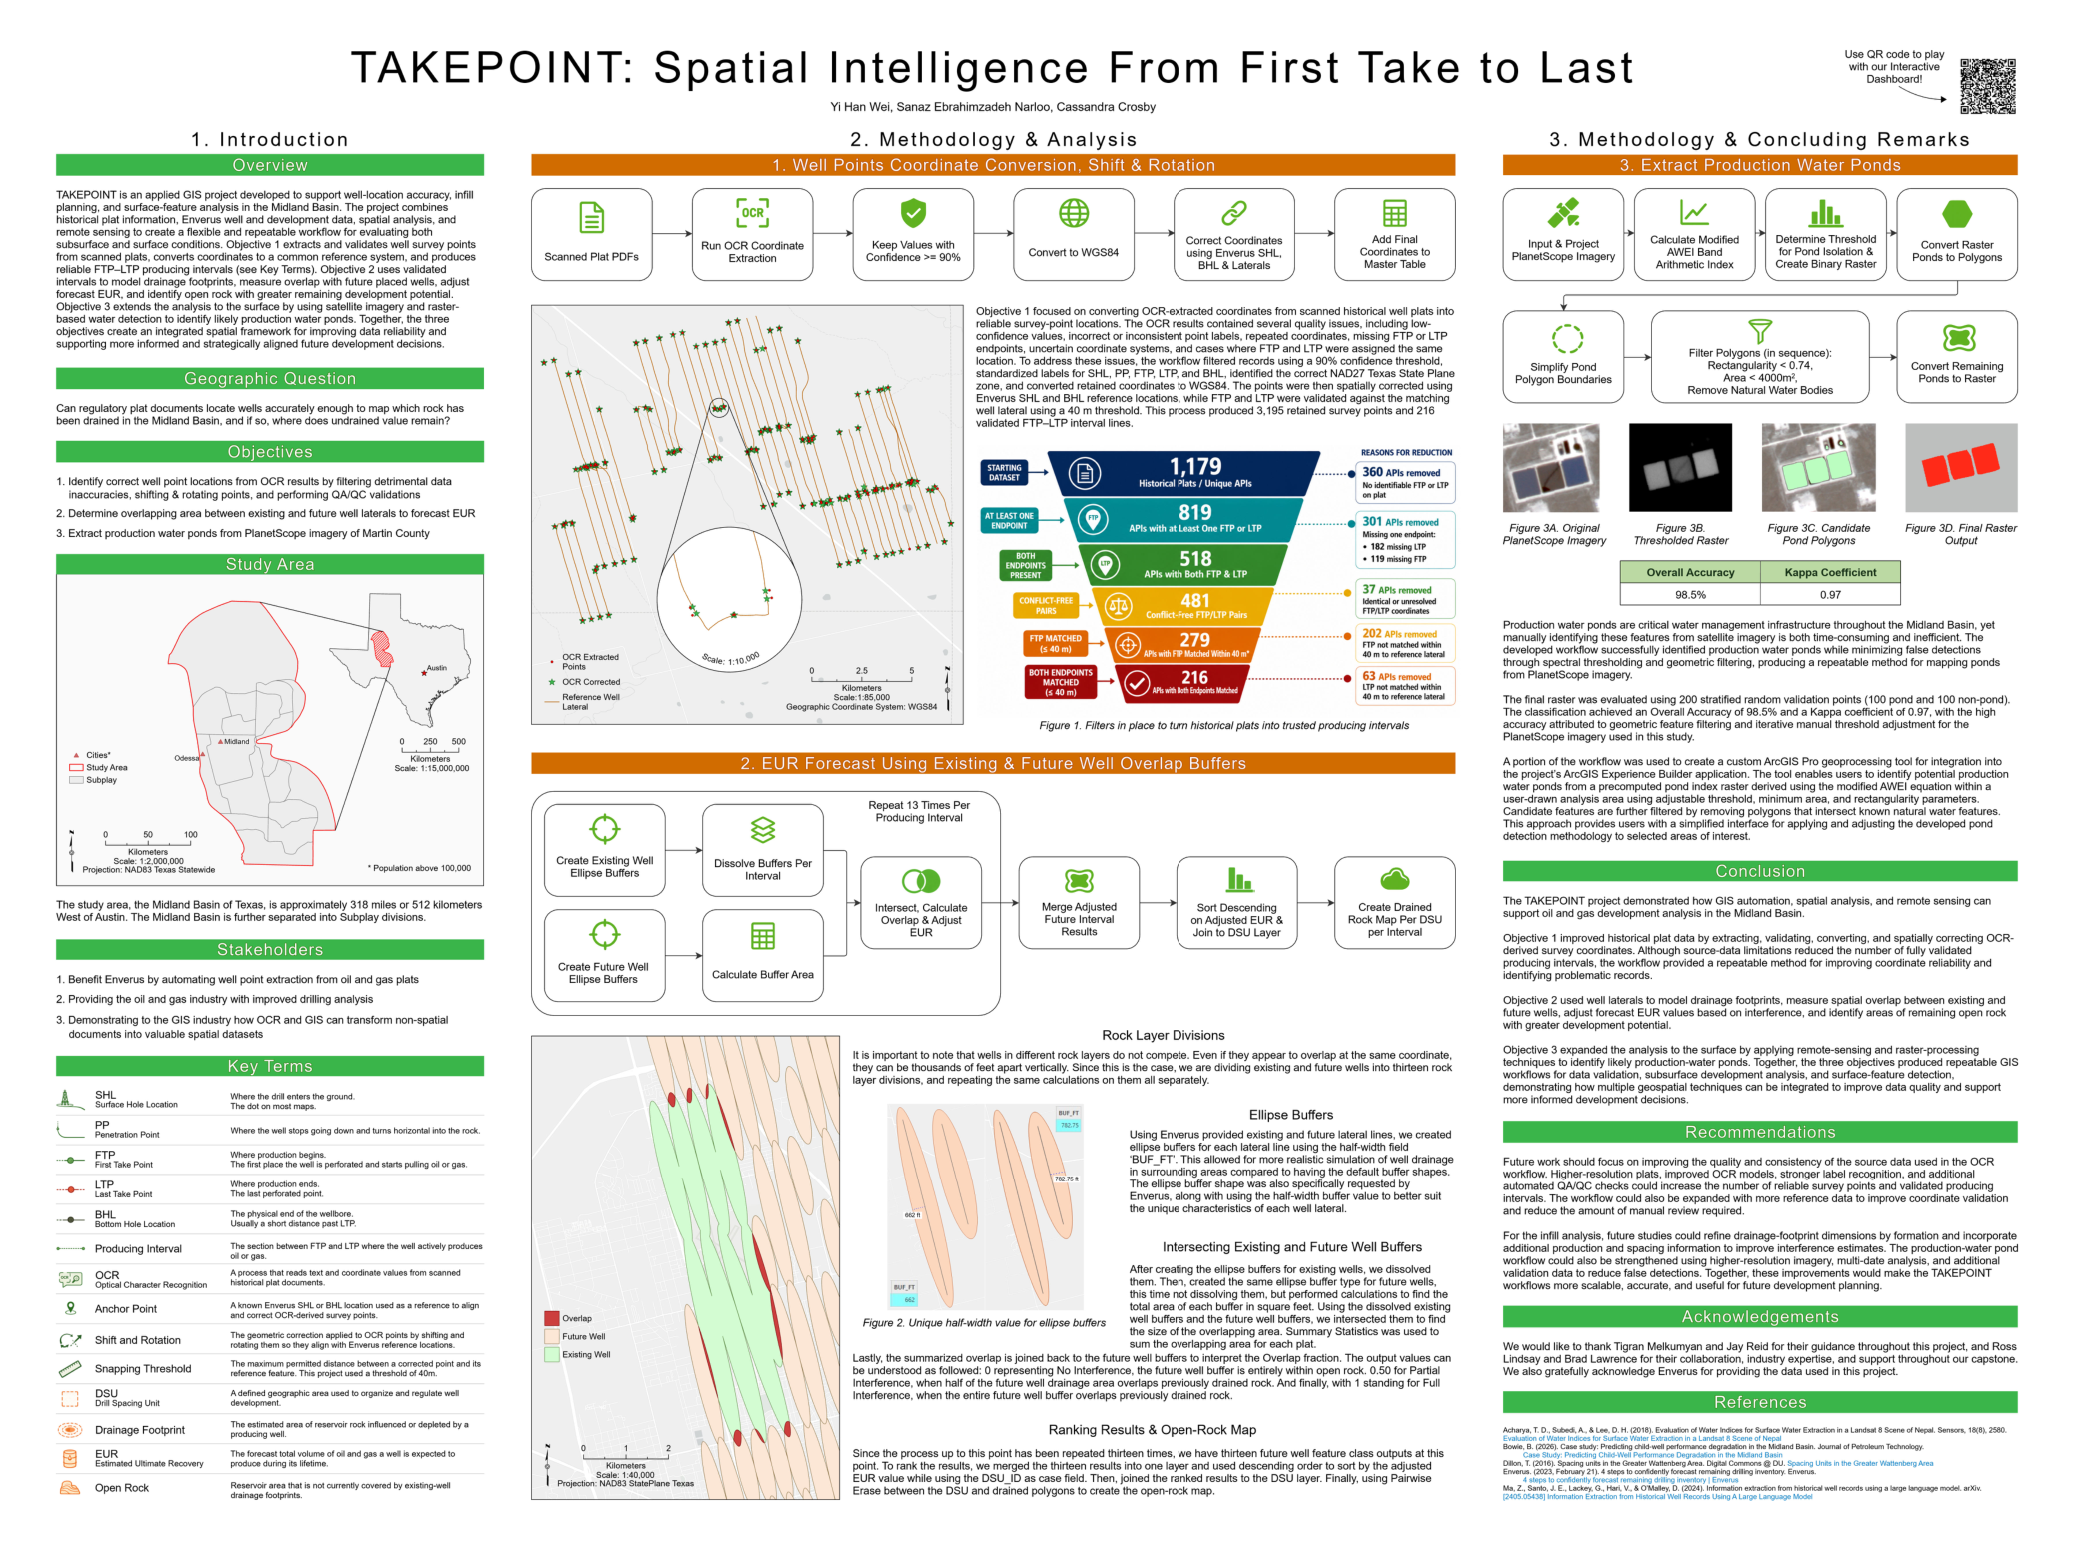
07 / Interactive experience
Explore TakePoint
Explore the project’s maps and analysis in ArcGIS Experience Builder.
Open TakePoint Experience