
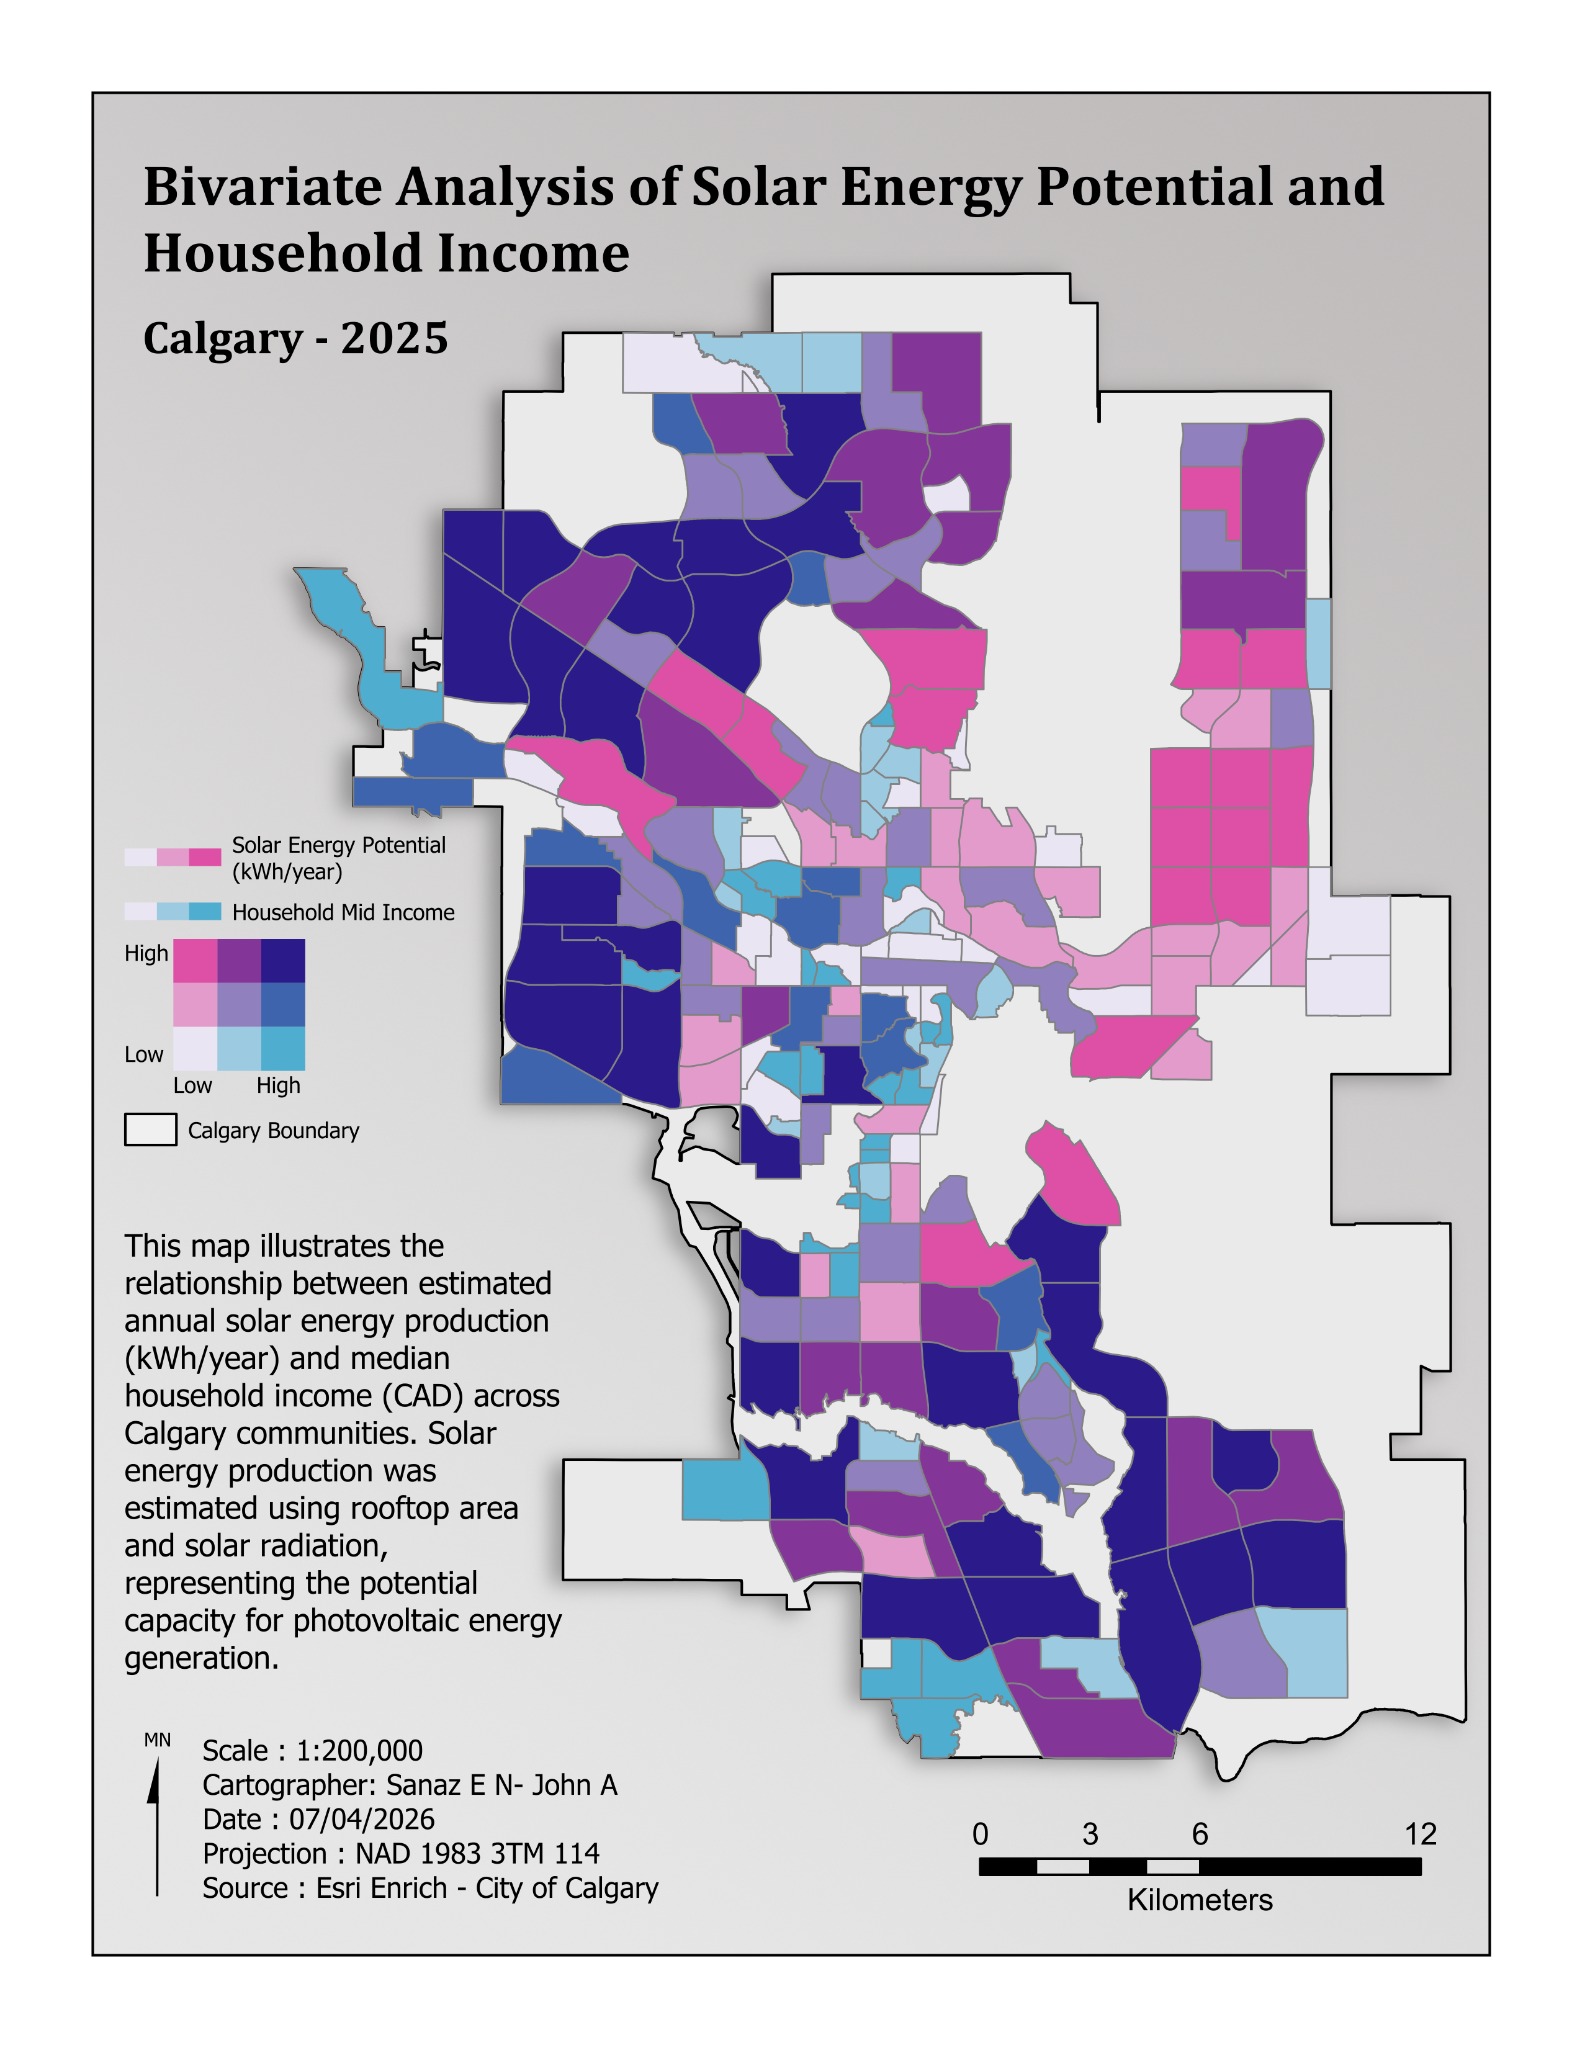
Solar & Environment
Solar potential & household income
Calgary · 2025
Estimated solar energy potential and median household income across Calgary communities.
Bivariate mapping
Sanaz Poroushani, John Abboud.
View projectCartography / Selected layouts
Different places. Different questions.
A collection of thematic maps, spatial analysis, and field mapping.
17 maps
Solar & Environment
Calgary · 2025
Estimated solar energy potential and median household income across Calgary communities.
Bivariate mapping
Sanaz Poroushani, John Abboud.
View project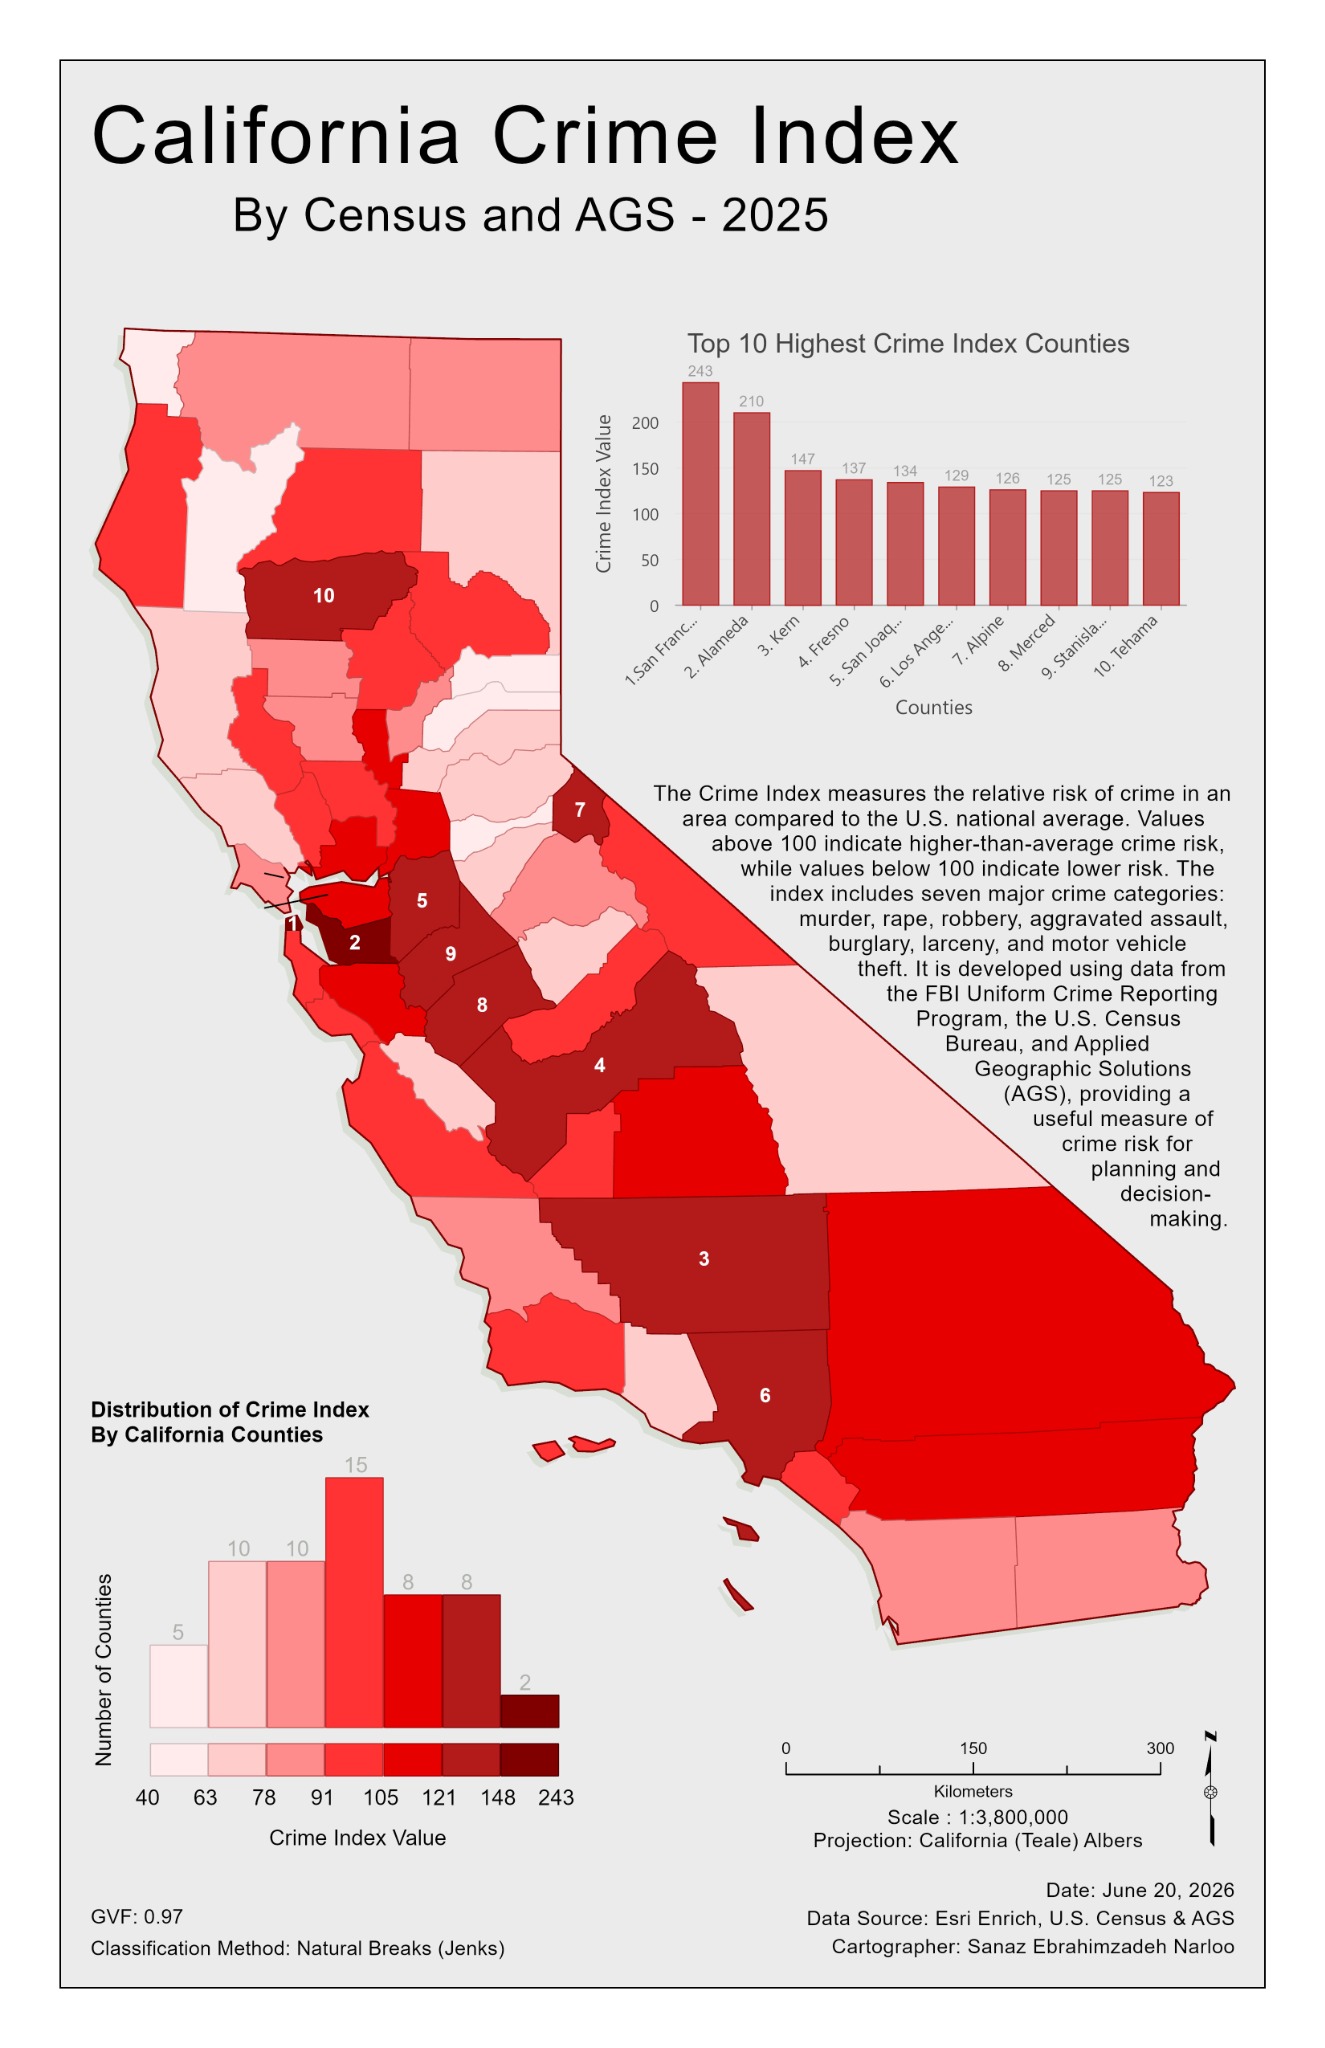
Thematic Mapping
California · 2025
County-level crime index with a ranked comparison and distribution chart.
Choropleth & chart layout
Sanaz Poroushani.
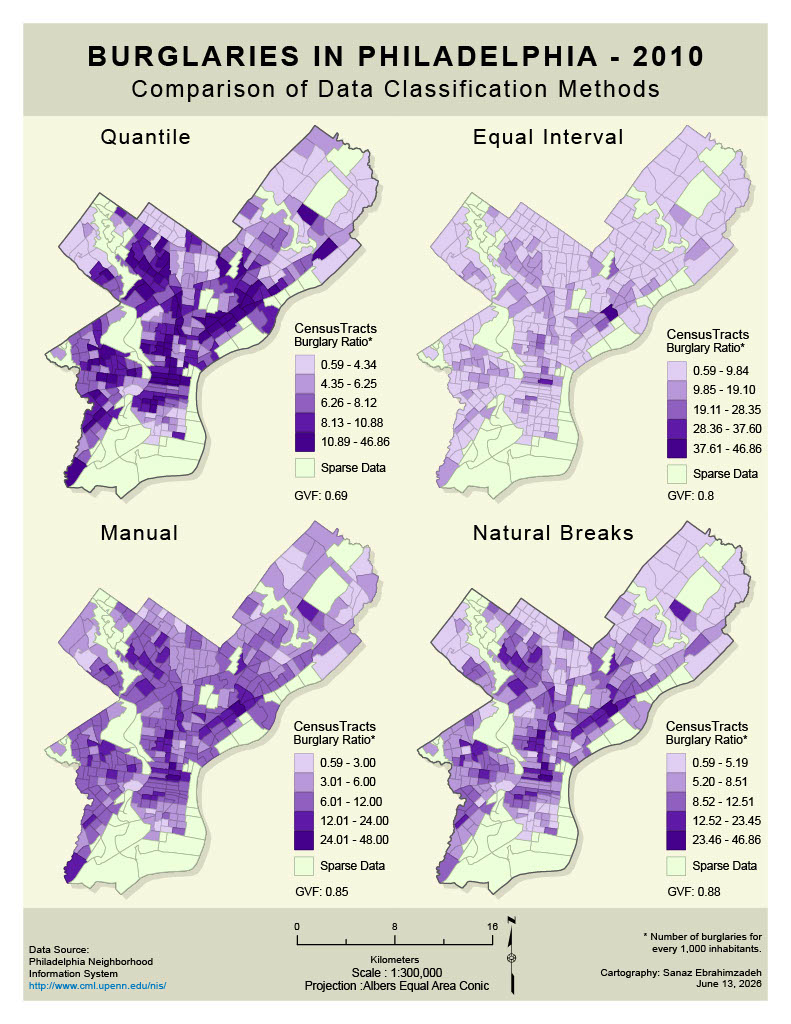
Thematic Mapping
Philadelphia · 2010
Burglary ratios mapped with quantile, equal interval, manual, and natural breaks classifications.
Classification comparison
Sanaz Poroushani.
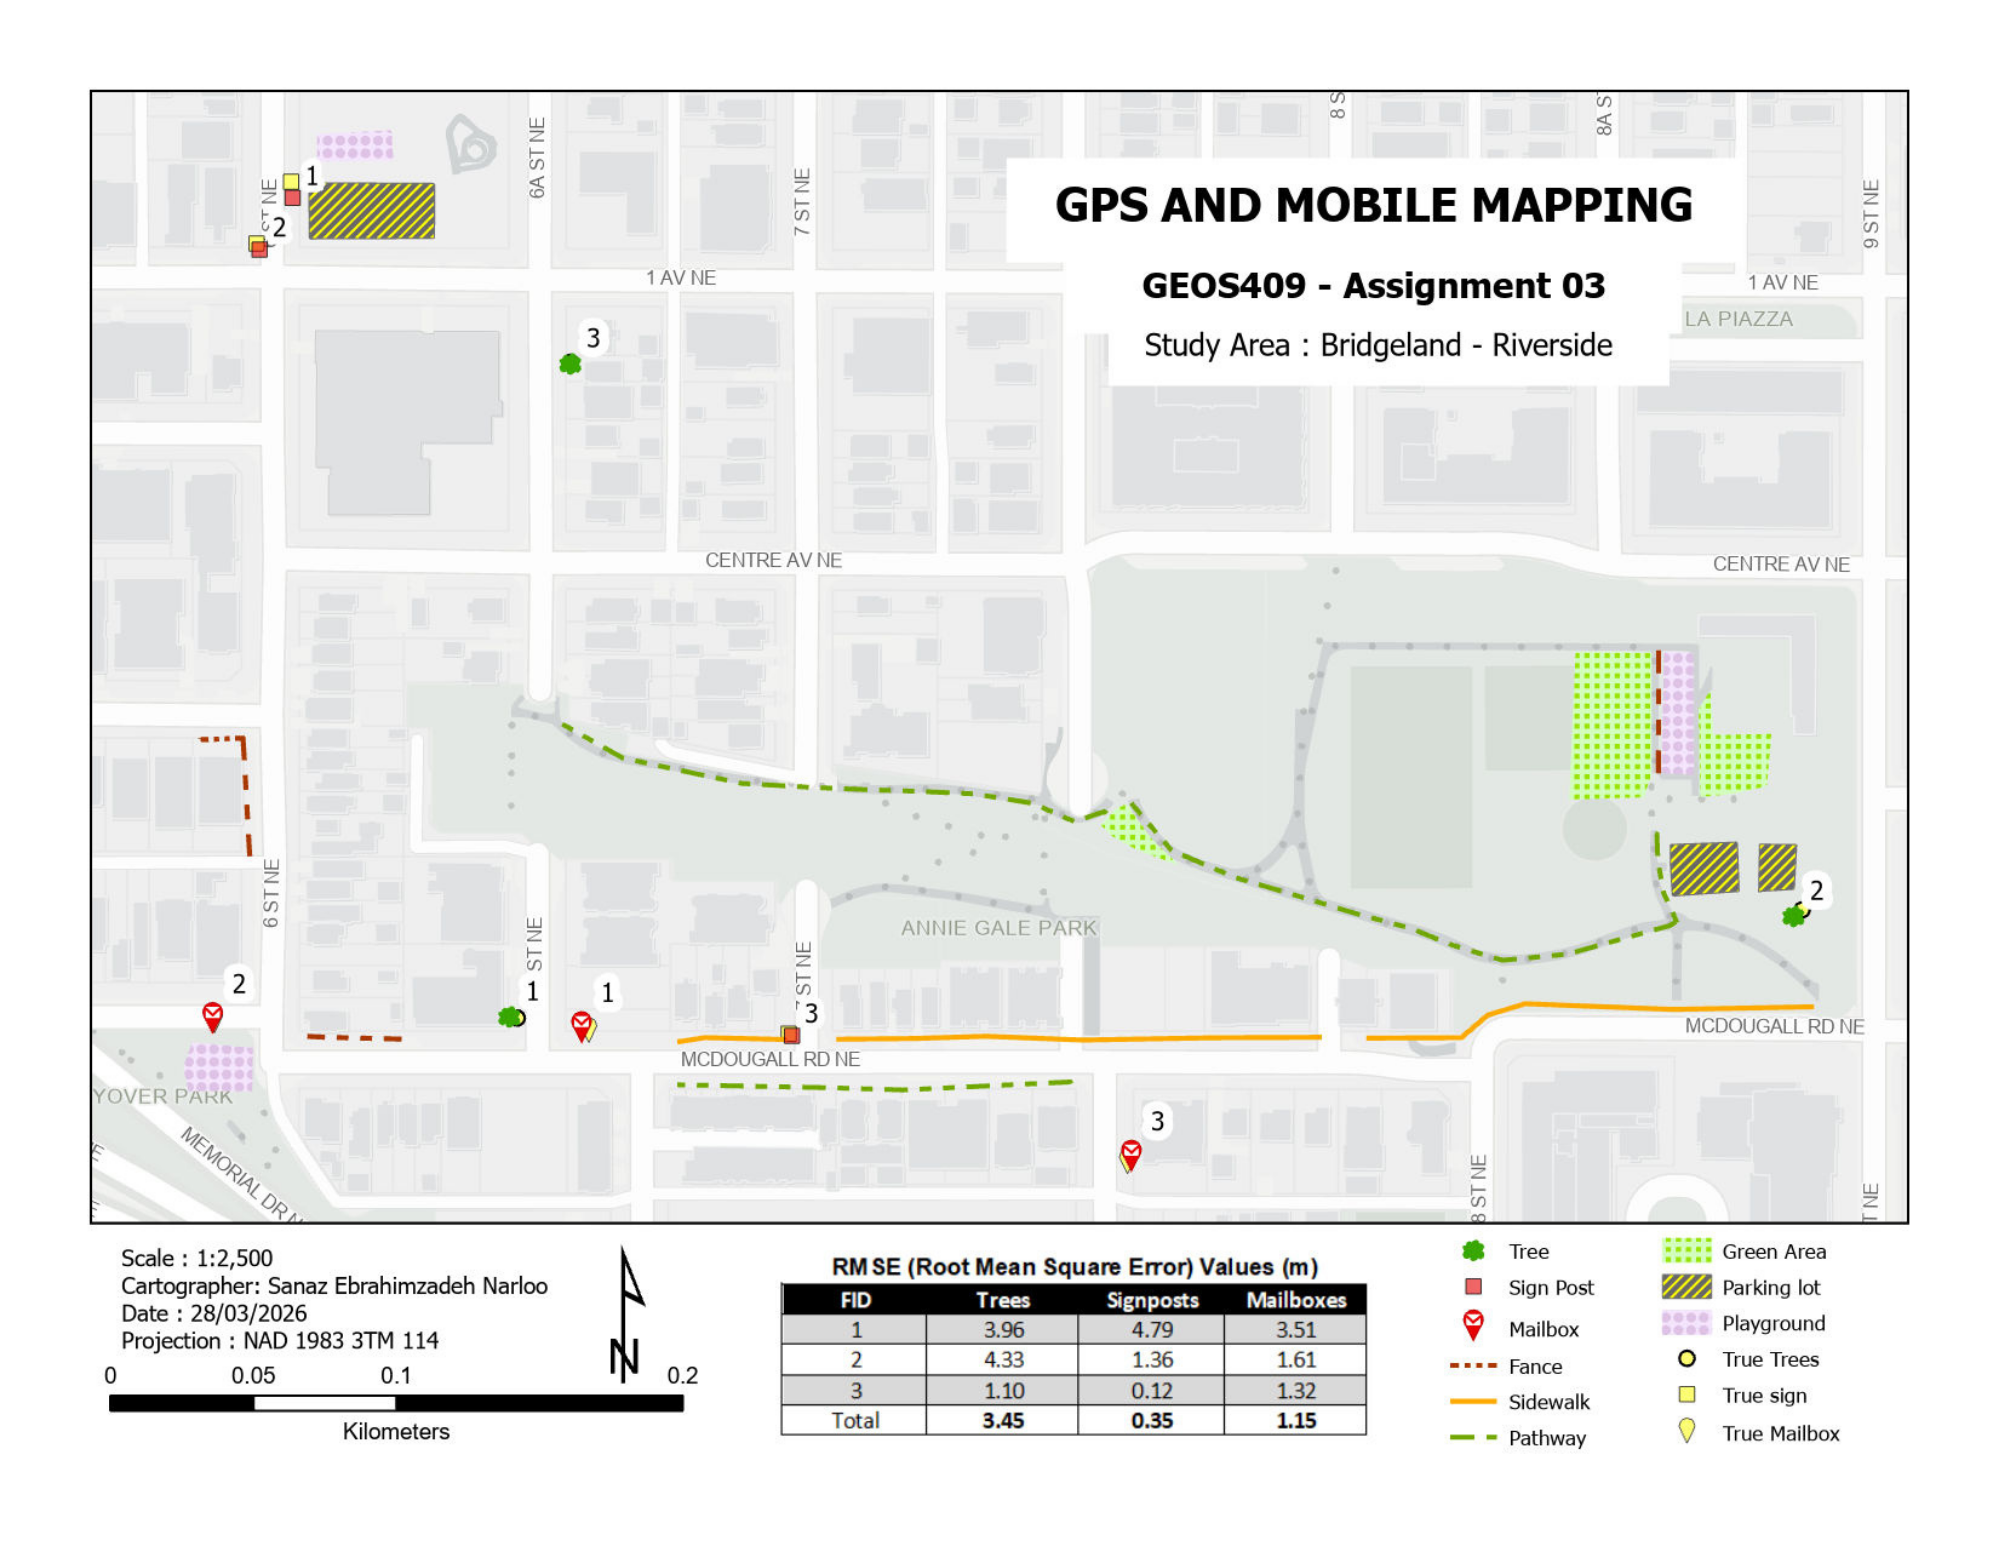
Field & Transport
Bridgeland–Riverside, Calgary
Mapped features and an RMSE table documenting positional comparisons for trees, signposts, and mailboxes.
Field mapping & positional QA
Sanaz Poroushani.
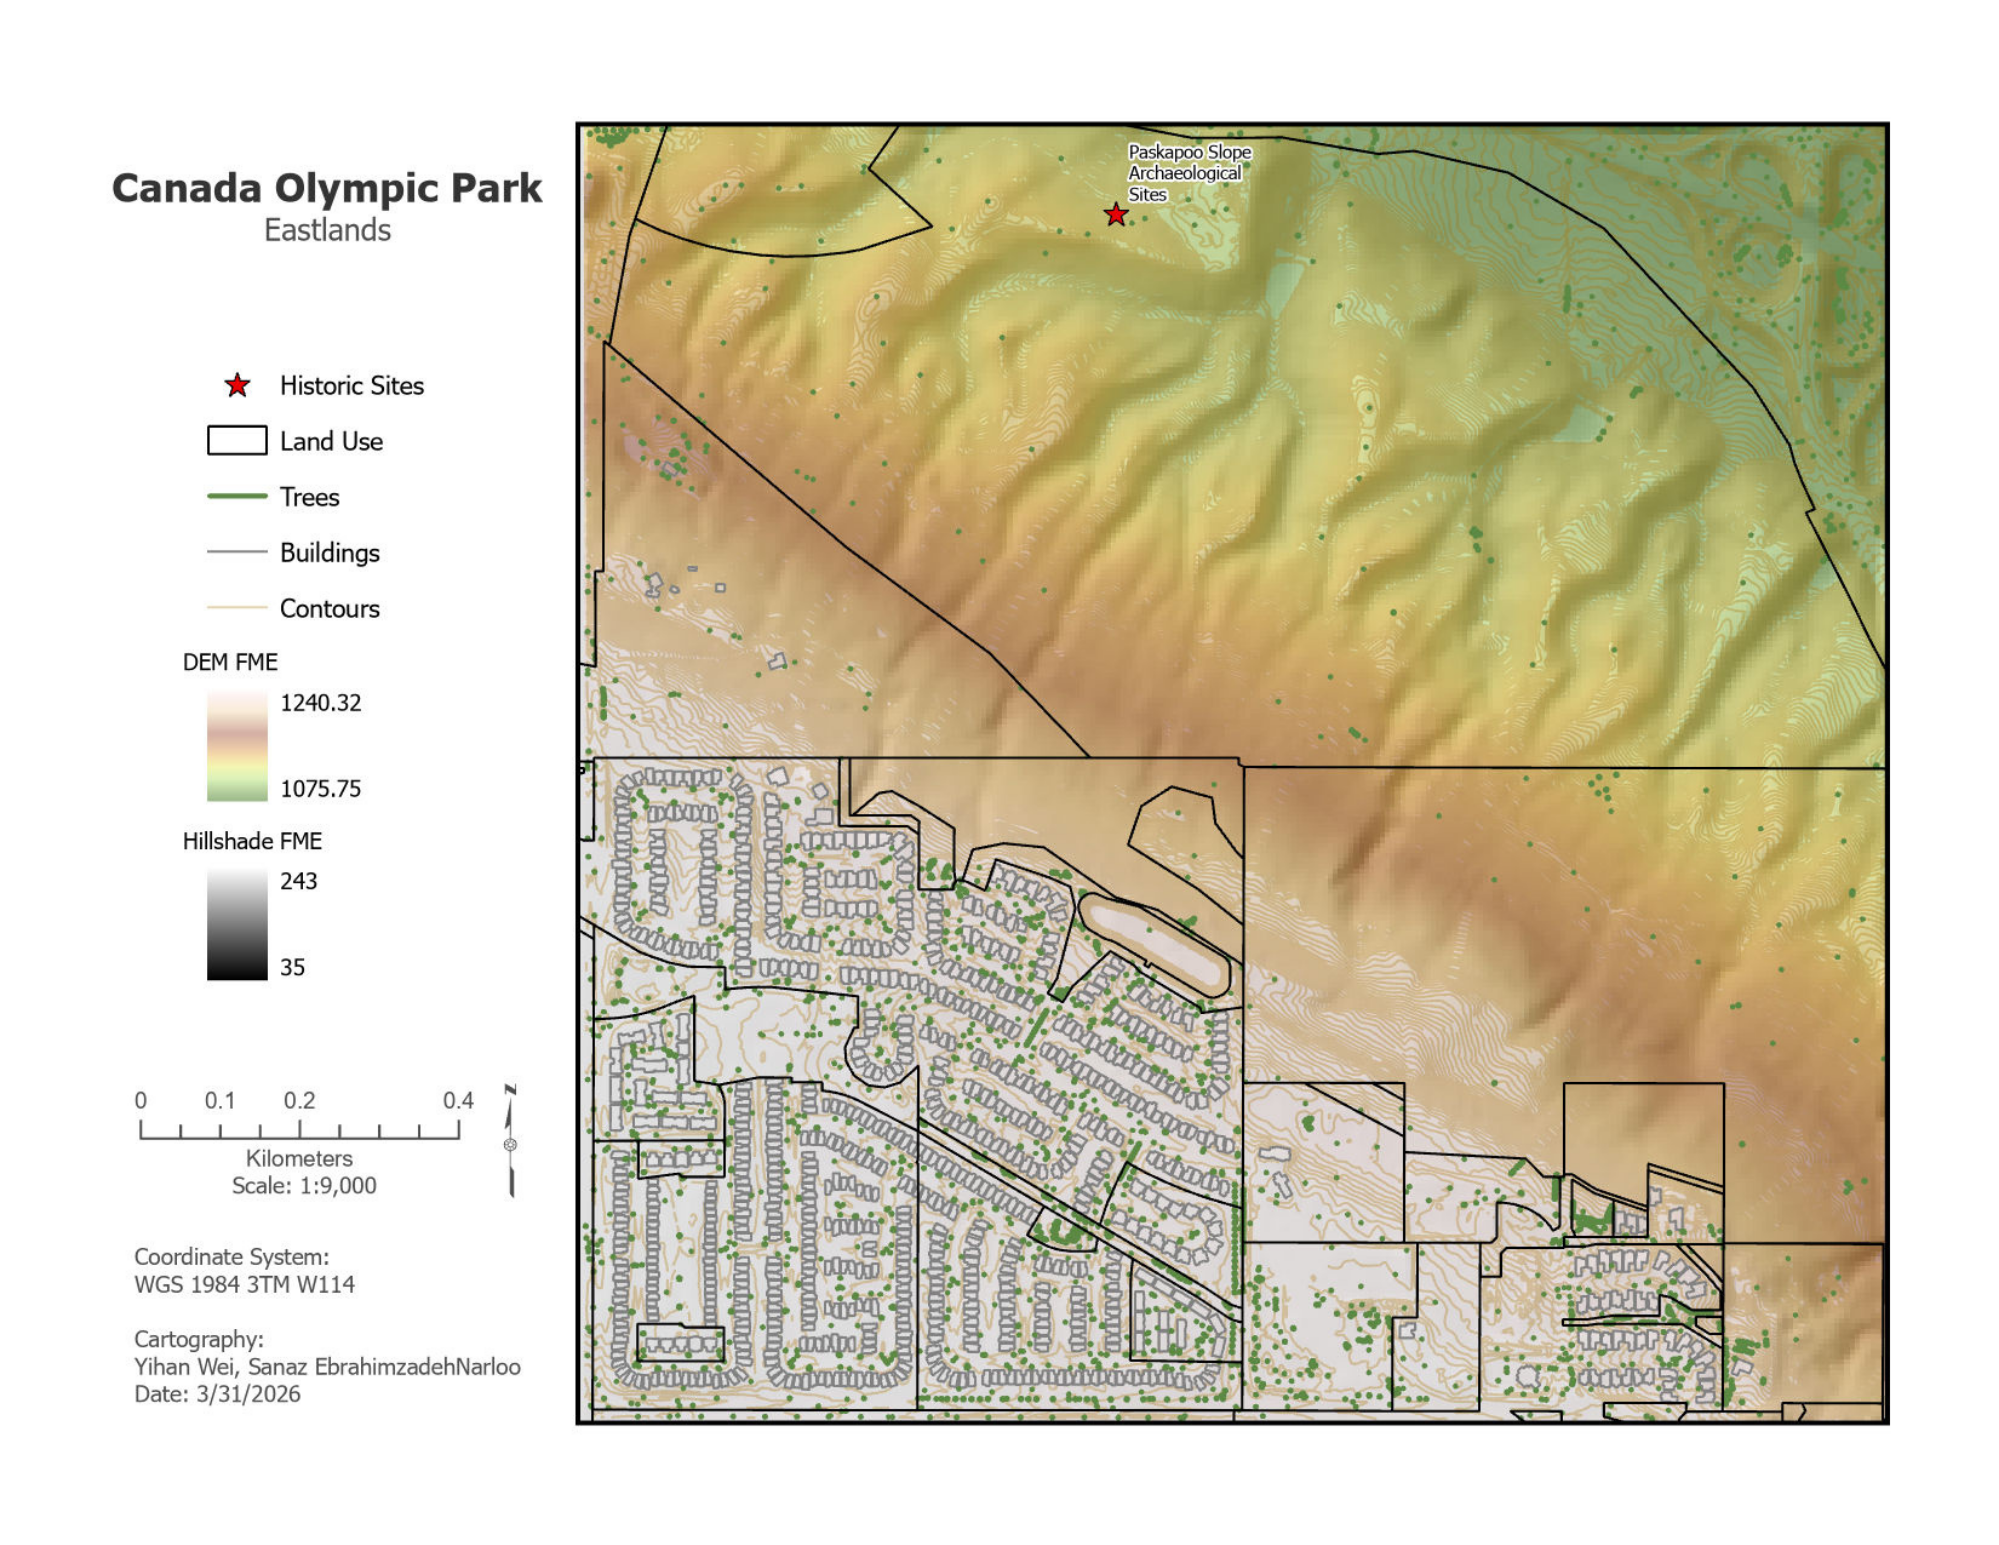
Solar & Environment
Calgary
Elevation, hillshade, contours, land use, buildings, trees, and historic sites in a terrain-focused layout.
Terrain & land-use mapping
Sanaz Poroushani, Yihan Wei.
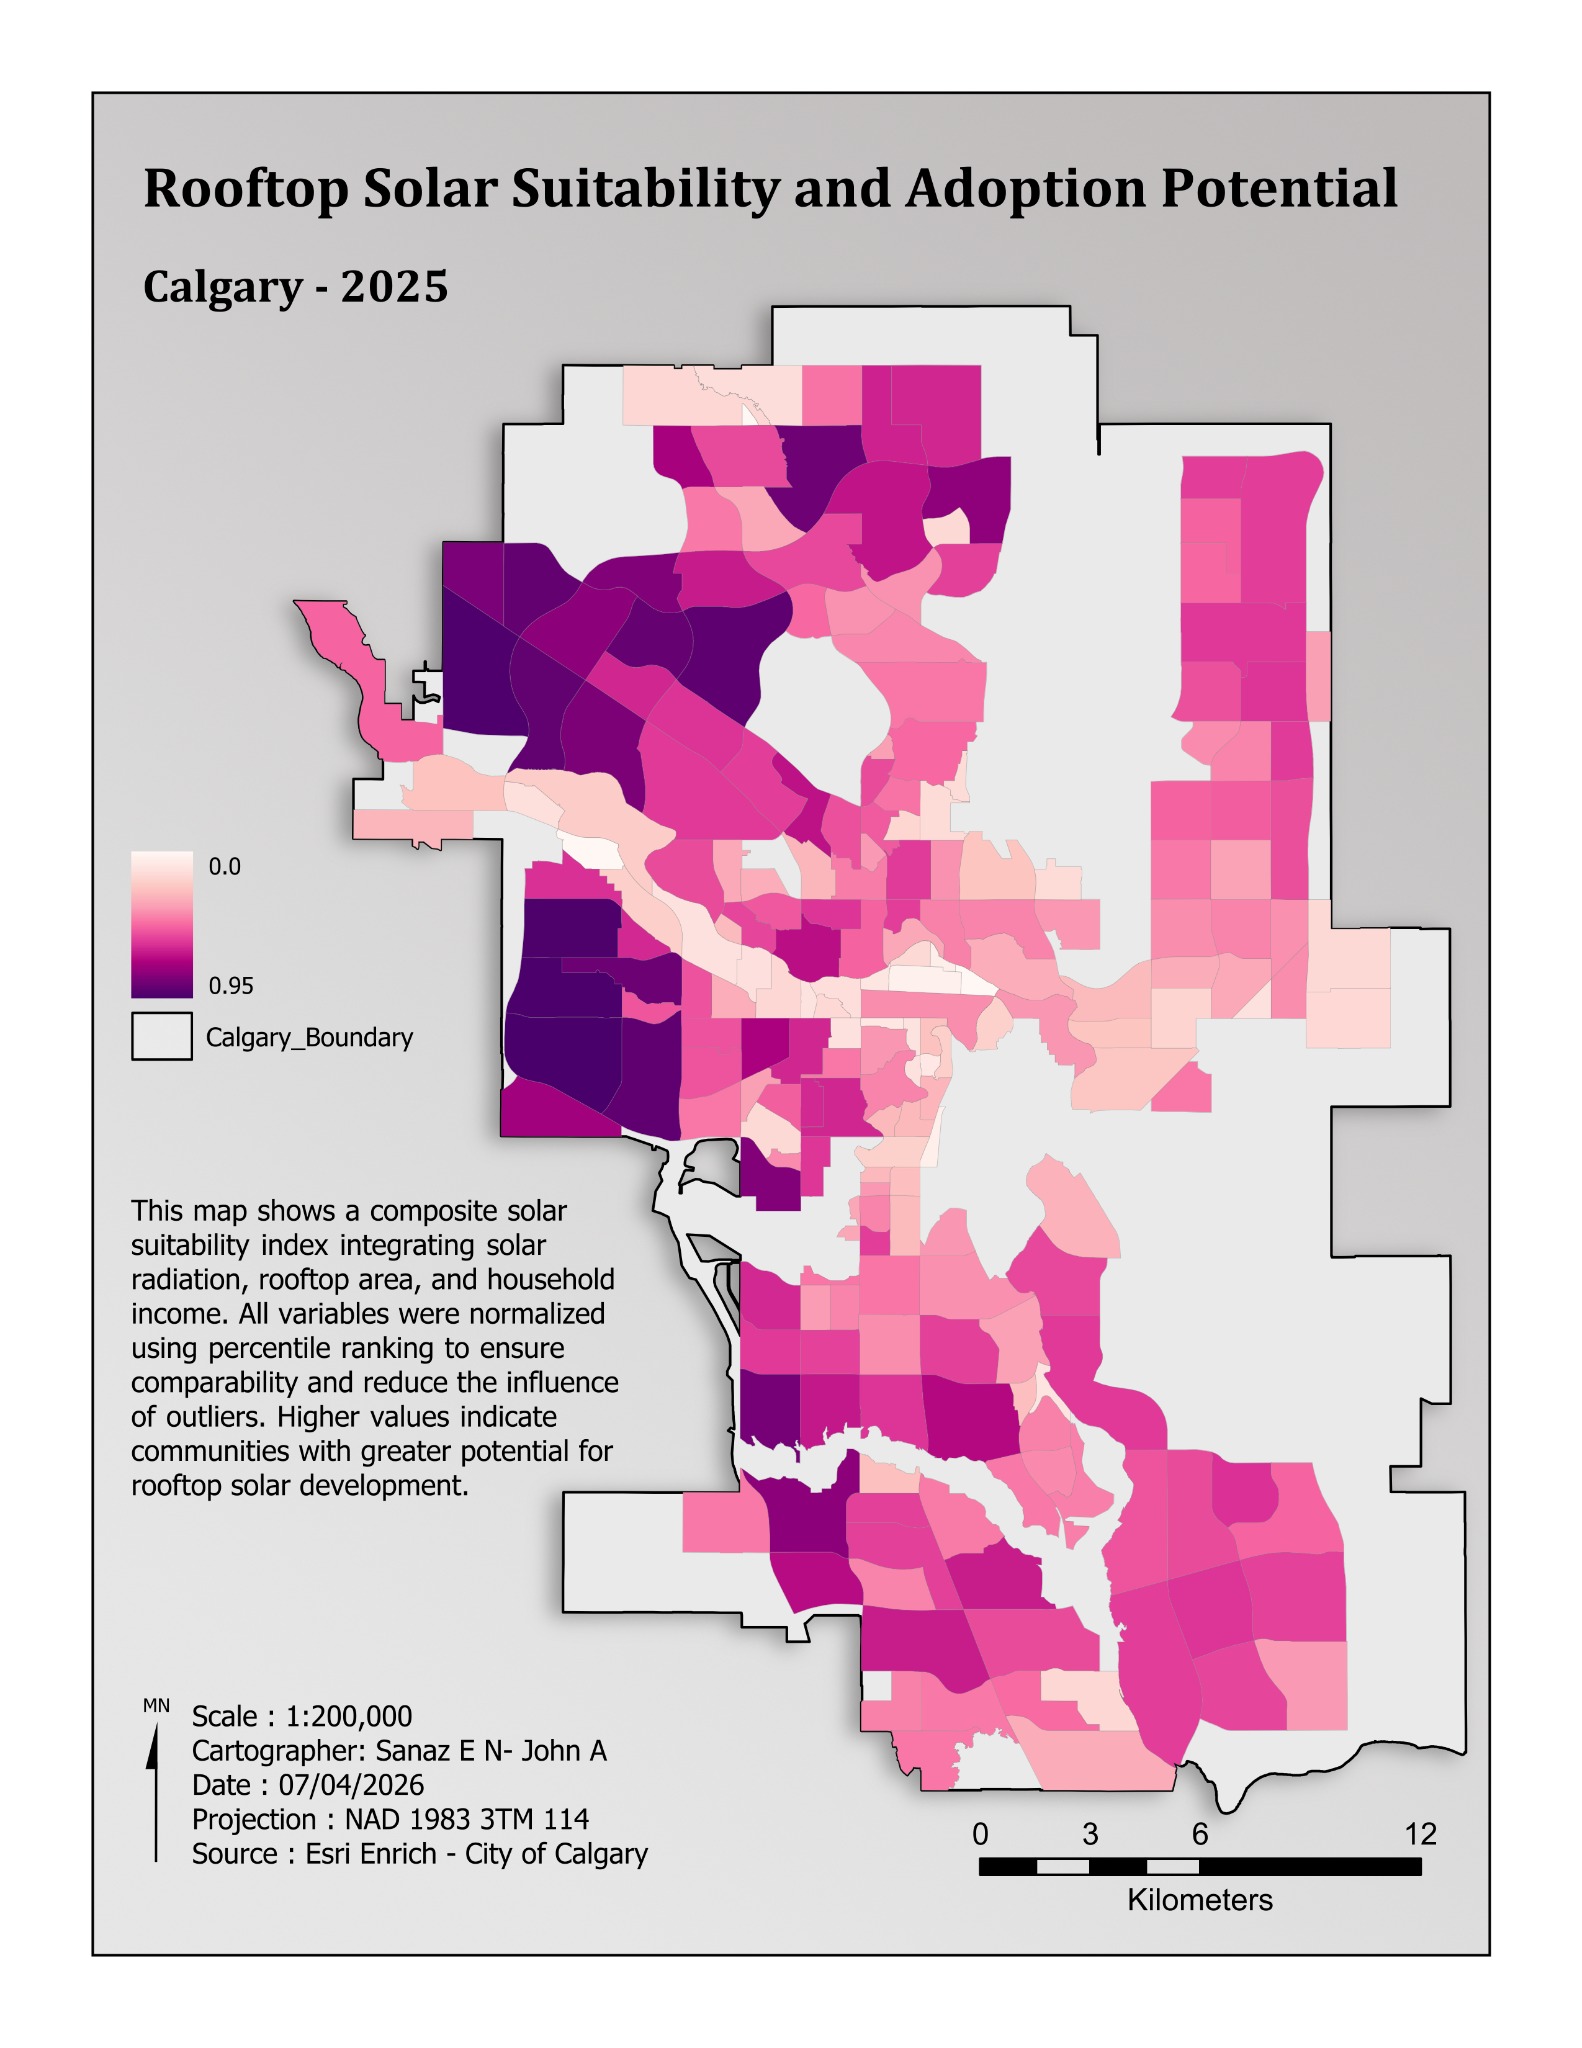
Solar & Environment
Calgary · 2025
A community-level index integrating solar radiation, rooftop area, and household income.
Composite index
Sanaz Poroushani, John Abboud.
View project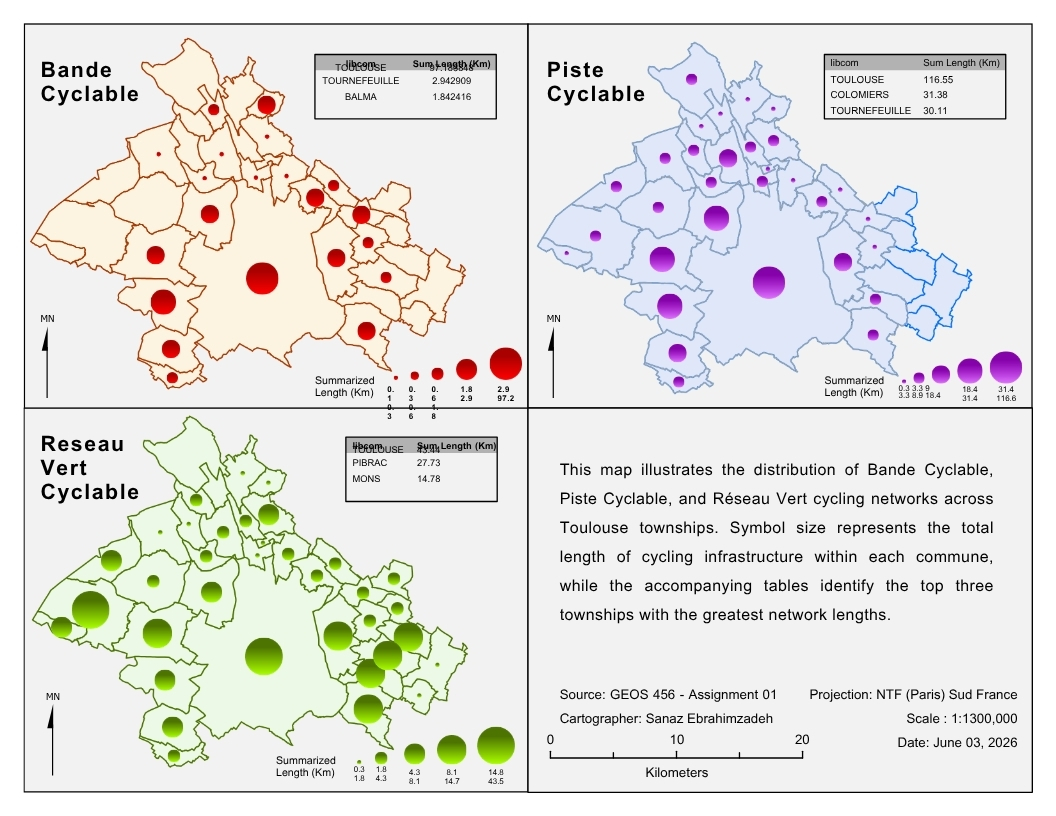
Field & Transport
Toulouse
Three cycling network types compared through symbol size, network lengths, and summary tables.
Graduated symbols & small multiples
Sanaz Poroushani.
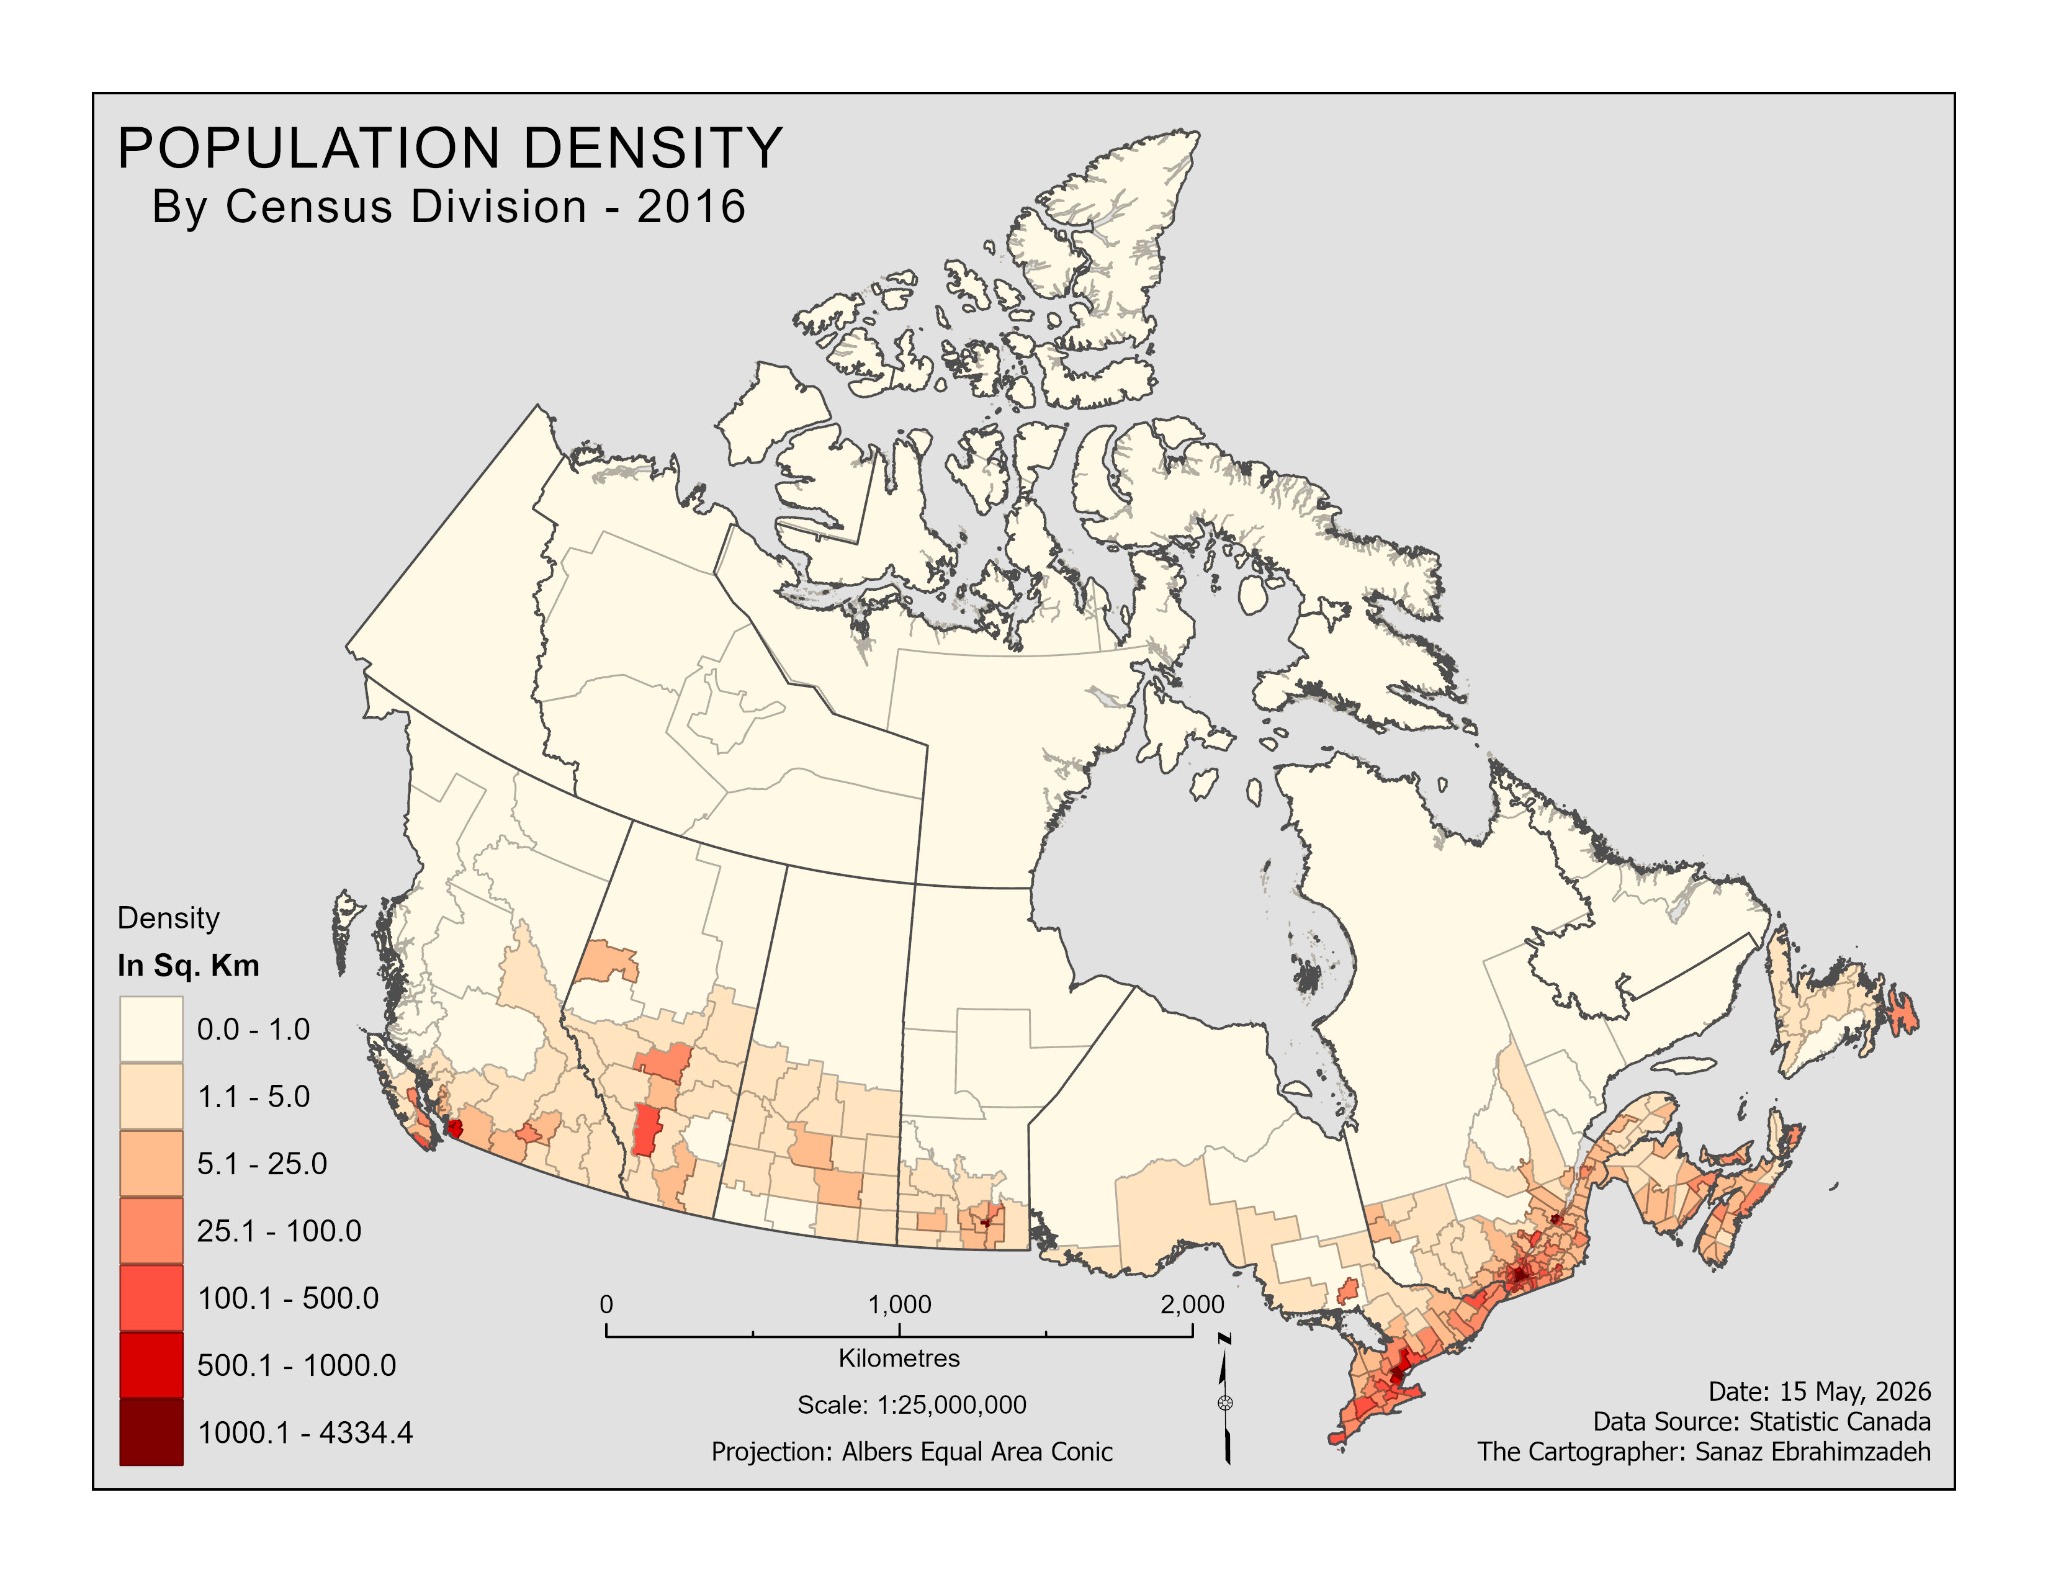
Population
Canada · 2016
Population density mapped by census division using a sequential colour scheme.
Choropleth mapping
Sanaz Poroushani.
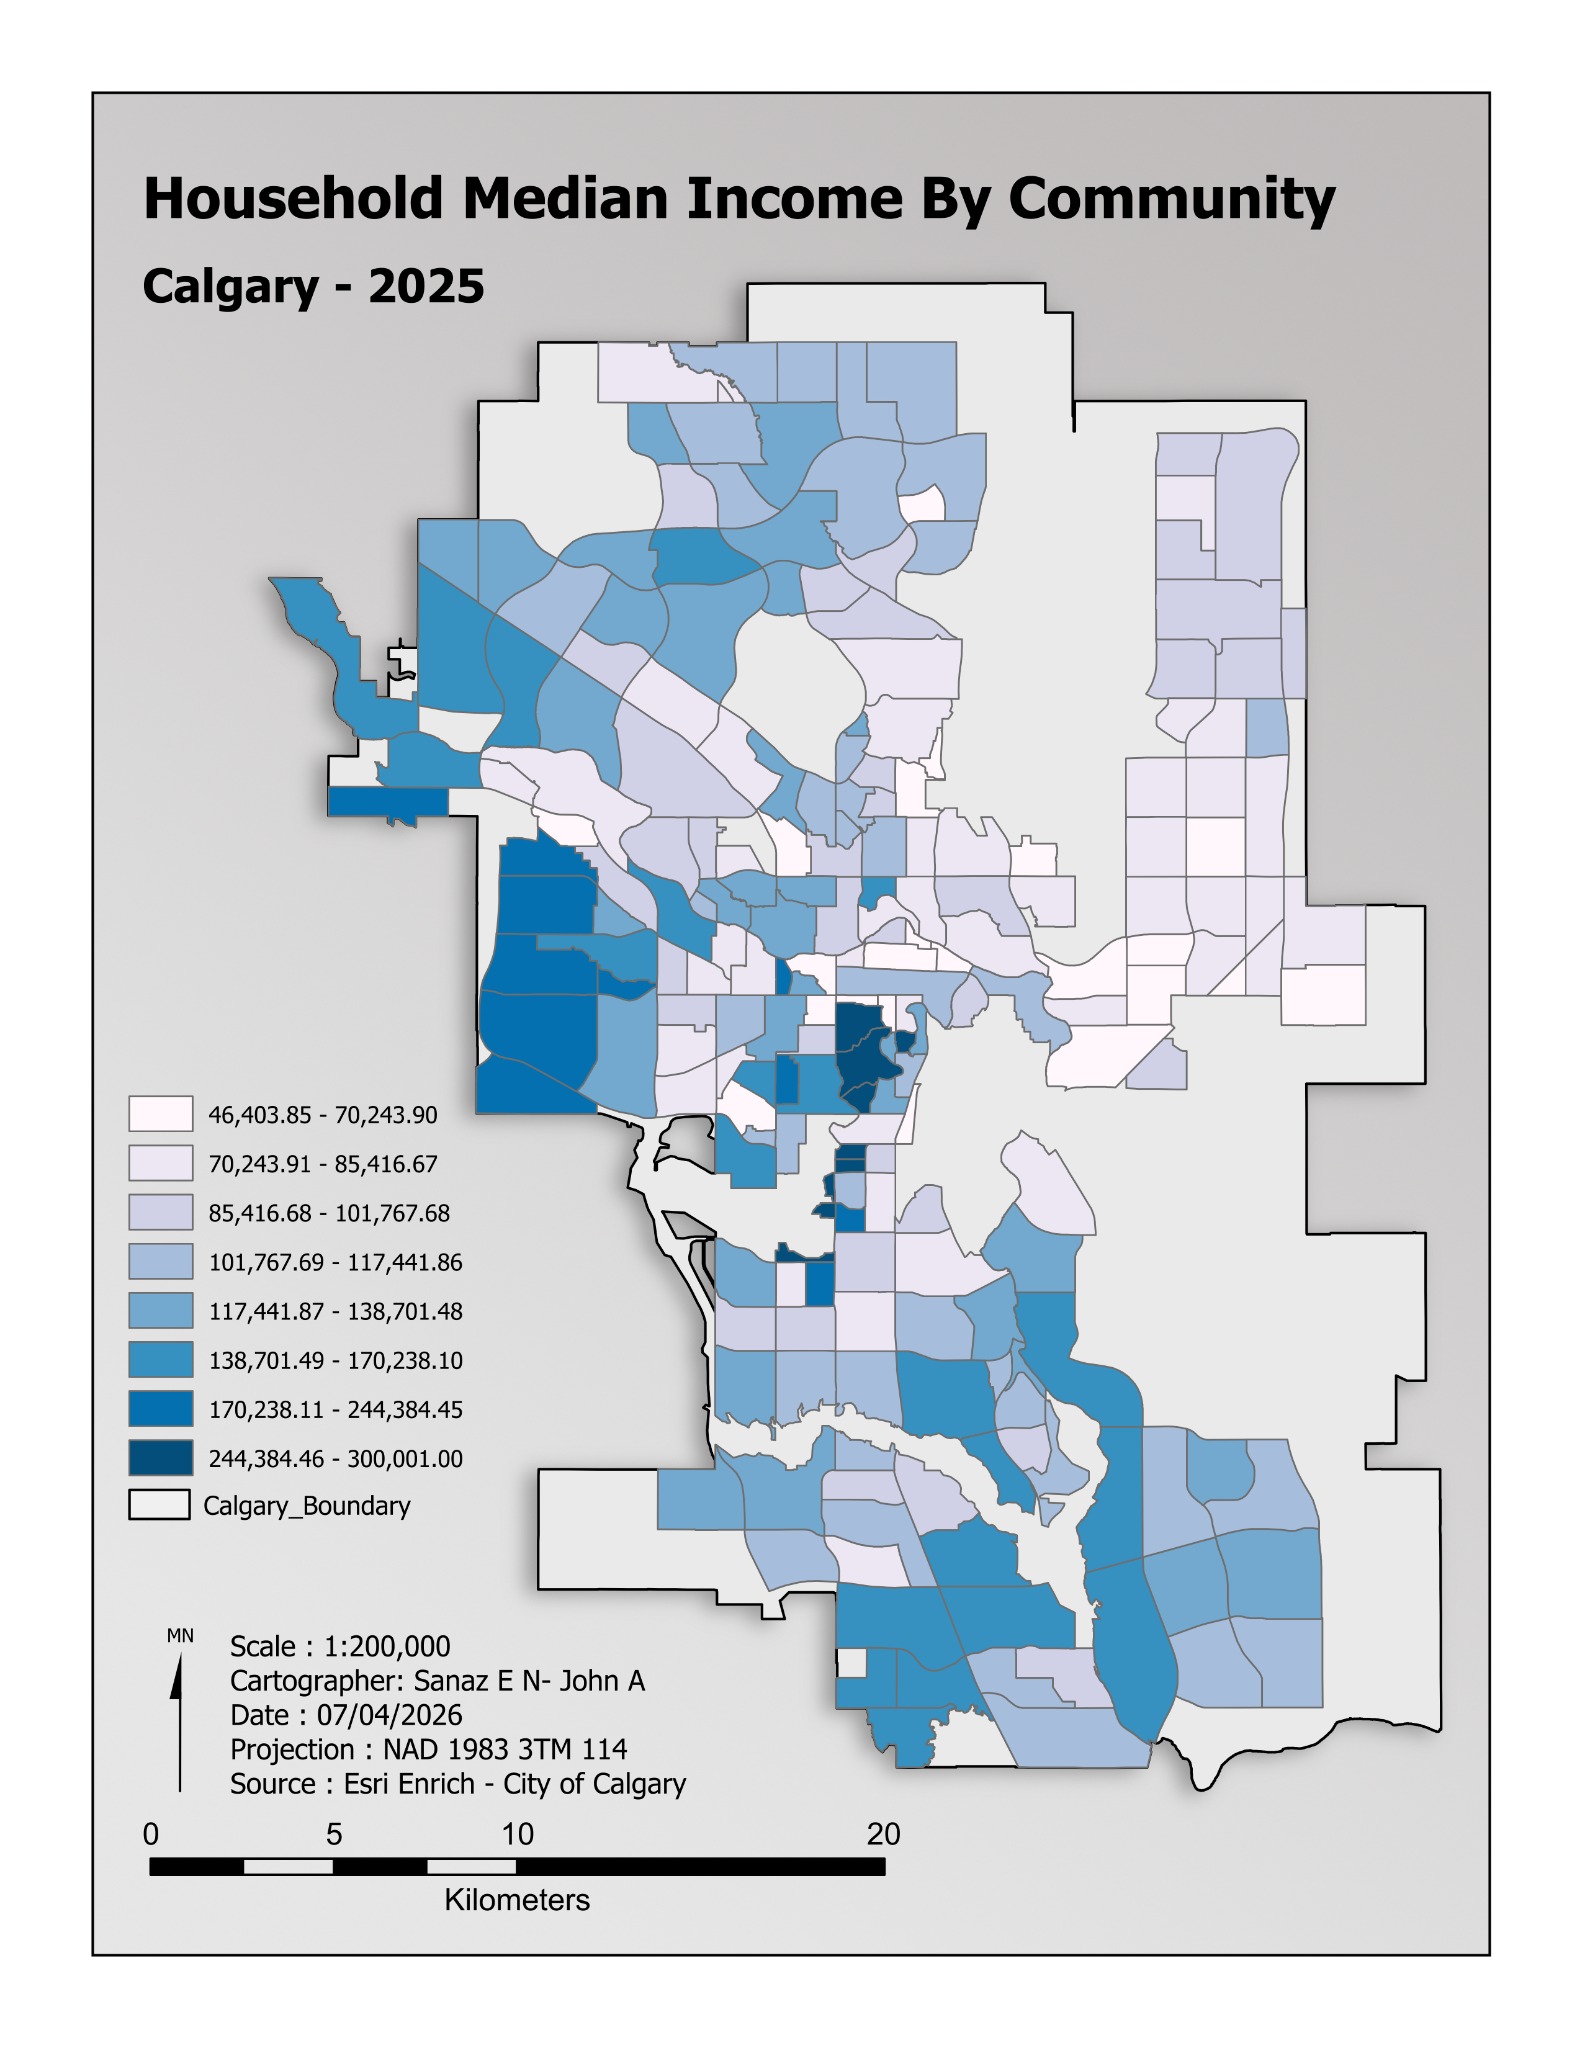
Population
Calgary · 2025
Community-level median household income with a blue sequential colour scheme.
Choropleth mapping
Sanaz Poroushani, John Abboud.
View project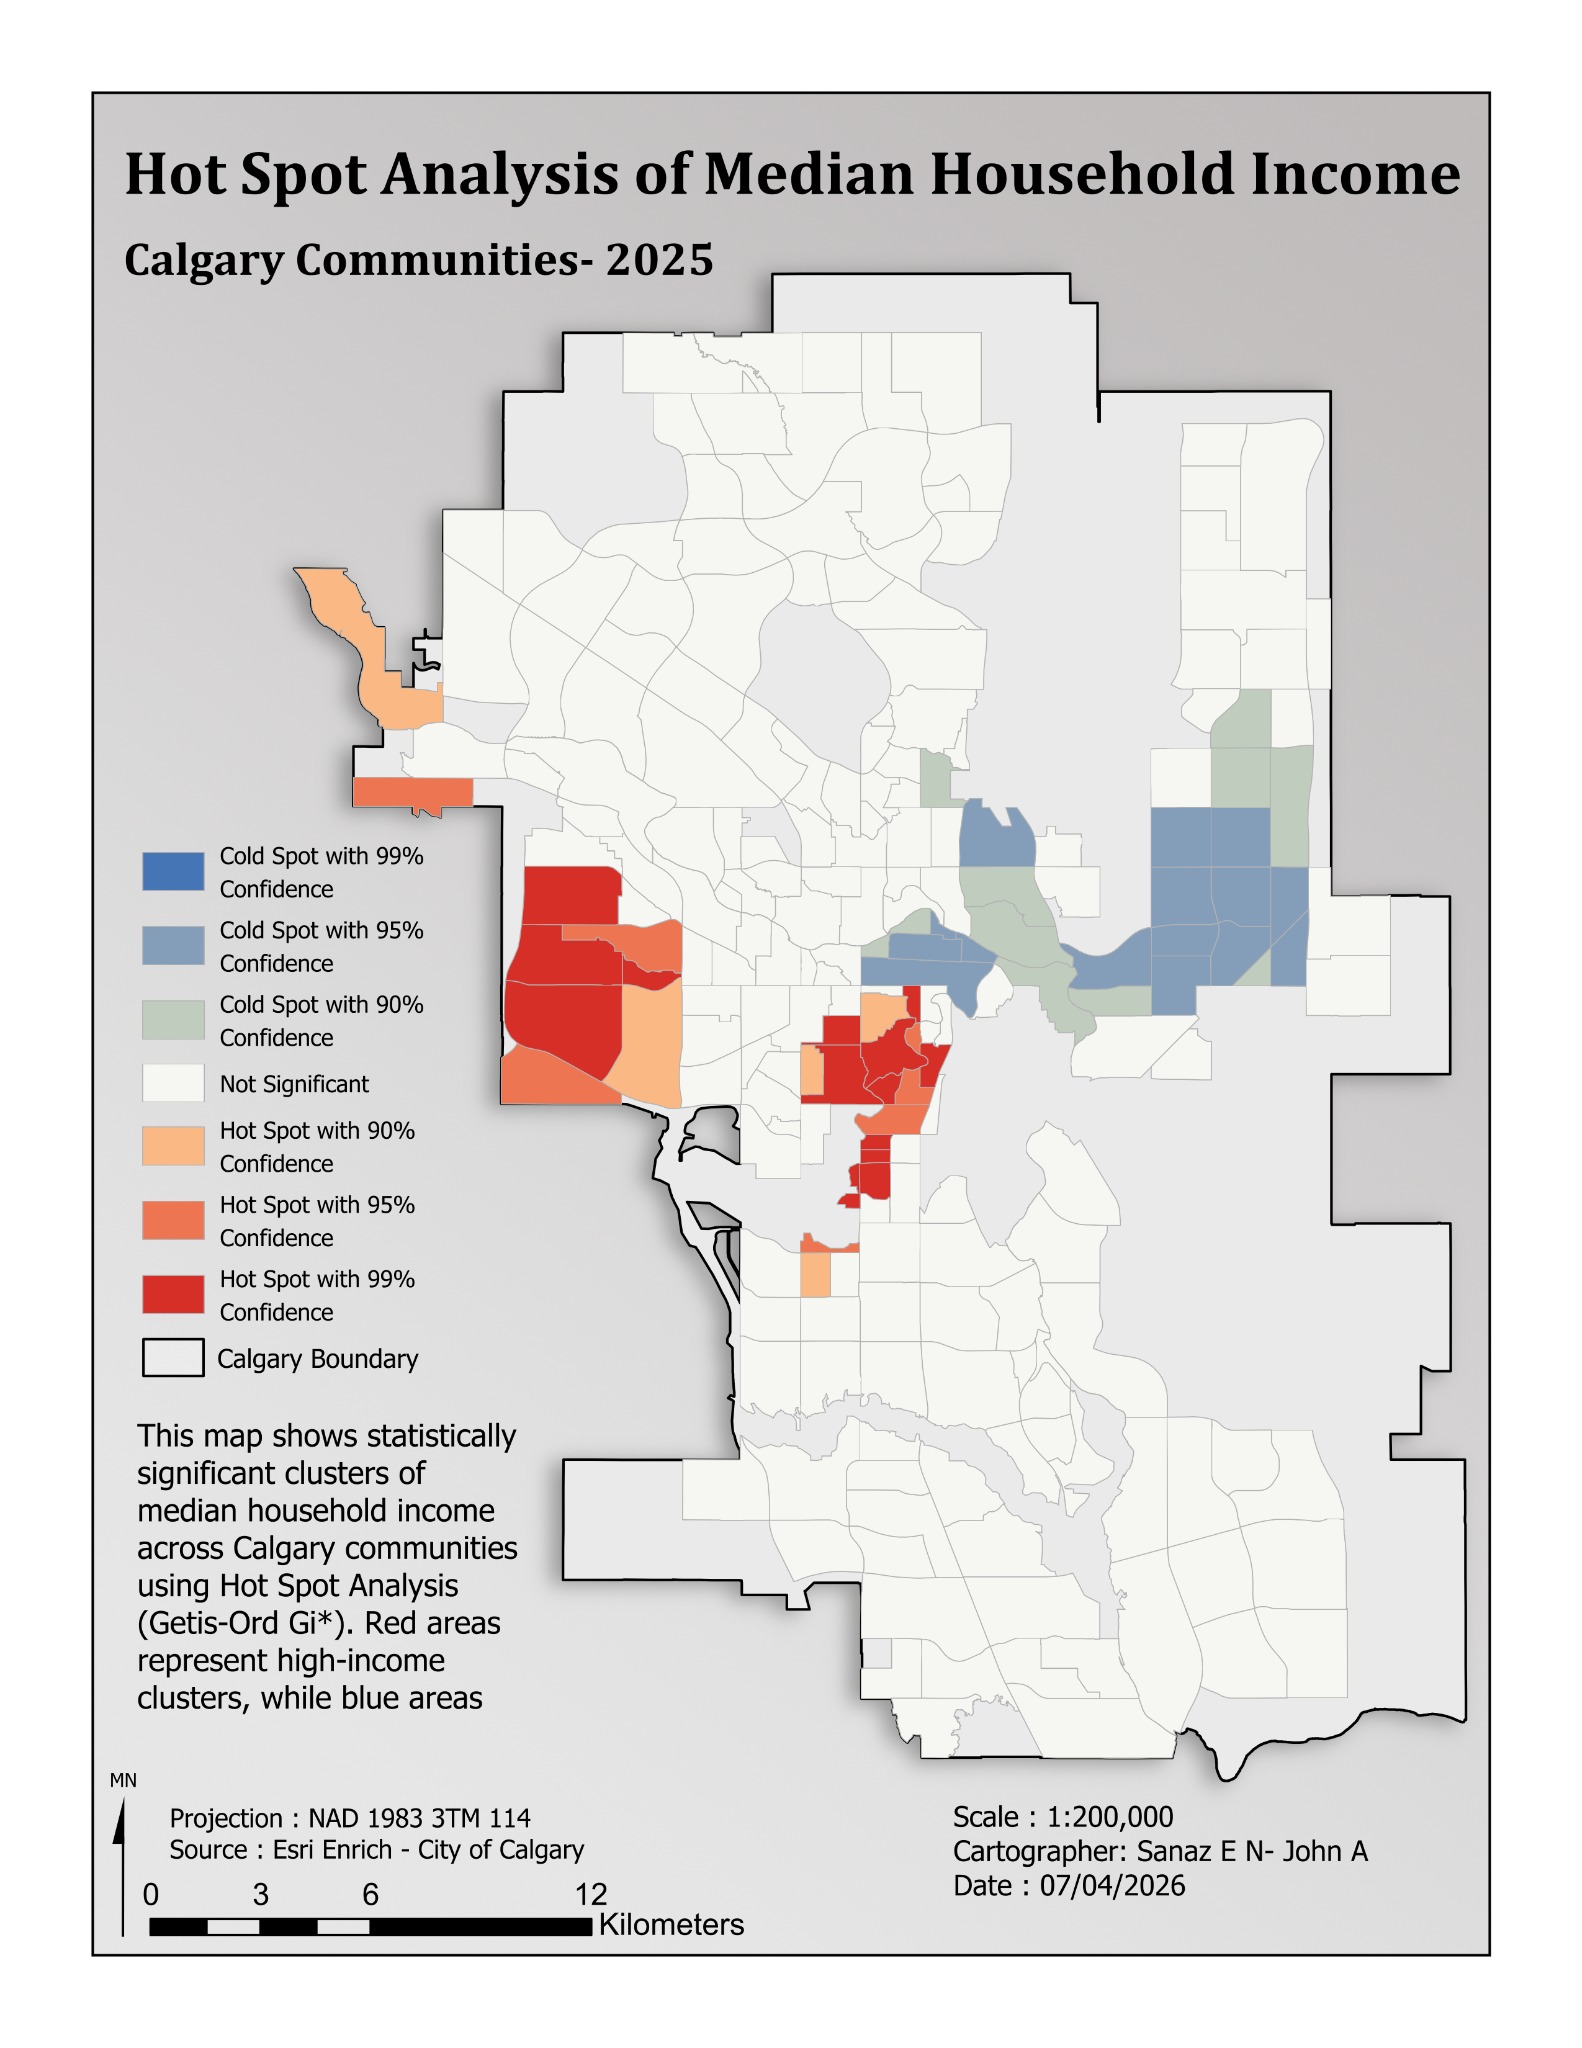
Spatial Statistics
Calgary communities · 2025
Income concentrations mapped with 90%, 95%, and 99% confidence classes.
Getis-Ord Gi*
Sanaz Poroushani, John Abboud.
View project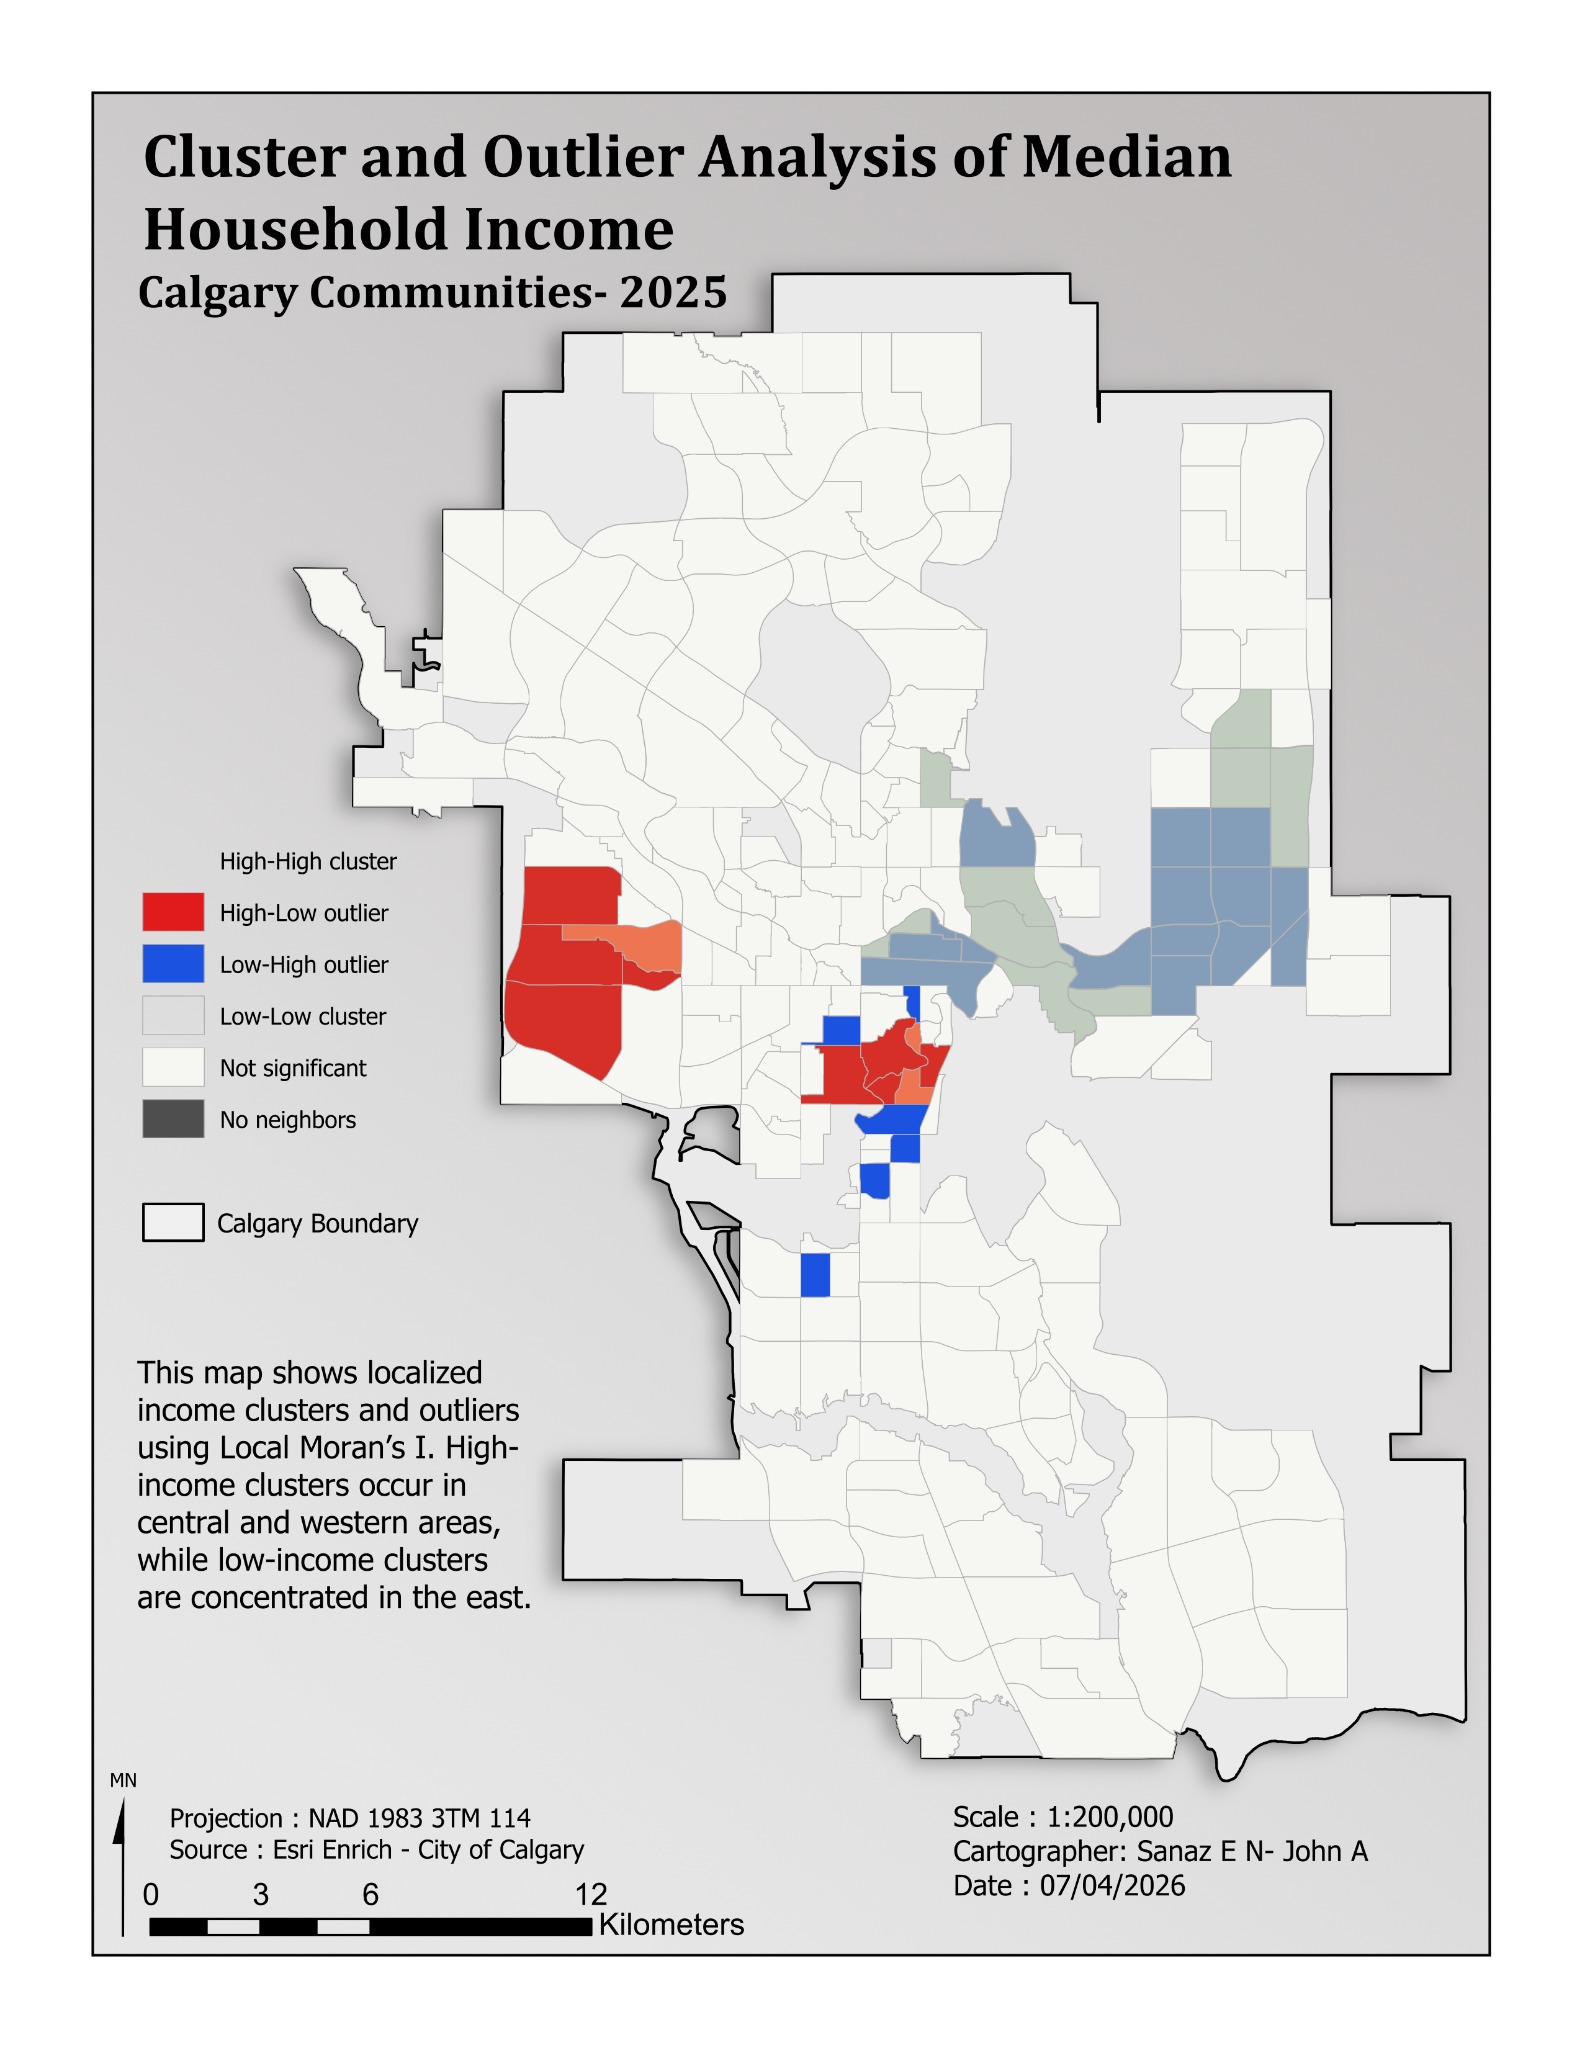
Spatial Statistics
Calgary communities · 2025
Local income clusters and spatial outliers shown alongside nonsignificant areas.
Local Moran’s I
Sanaz Poroushani, John Abboud.
View project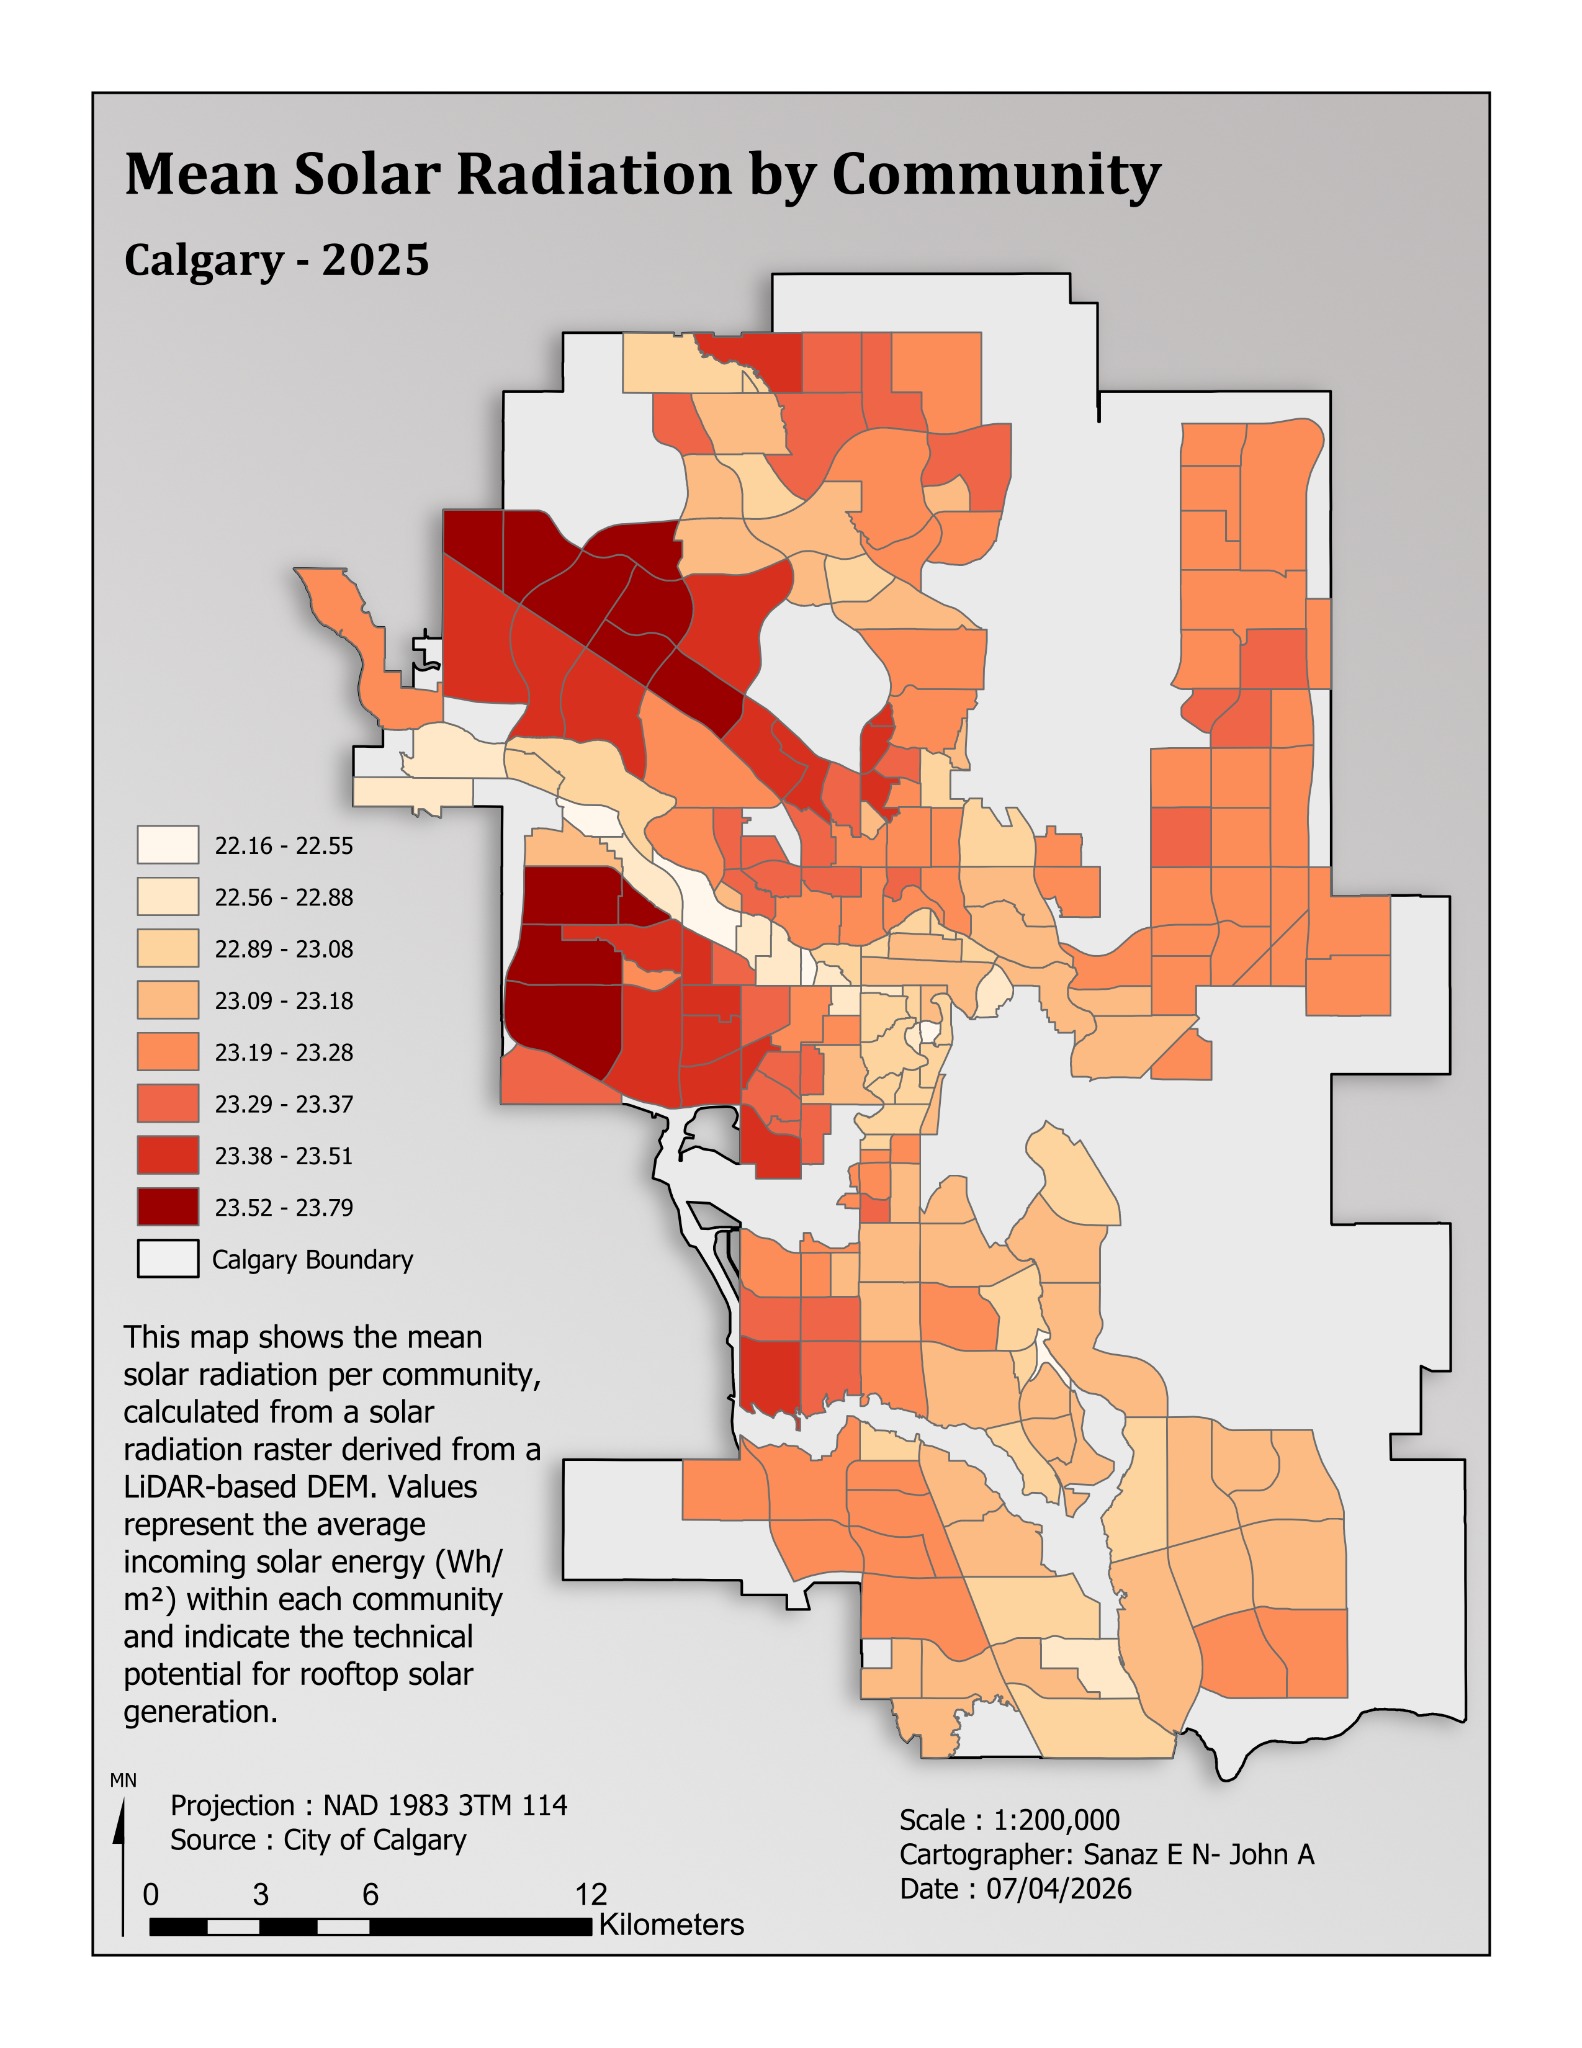
Solar & Environment
Calgary · 2025
Mean incoming solar energy derived from a LiDAR-based DEM and summarized by community.
Community choropleth
Sanaz Poroushani, John Abboud.
View project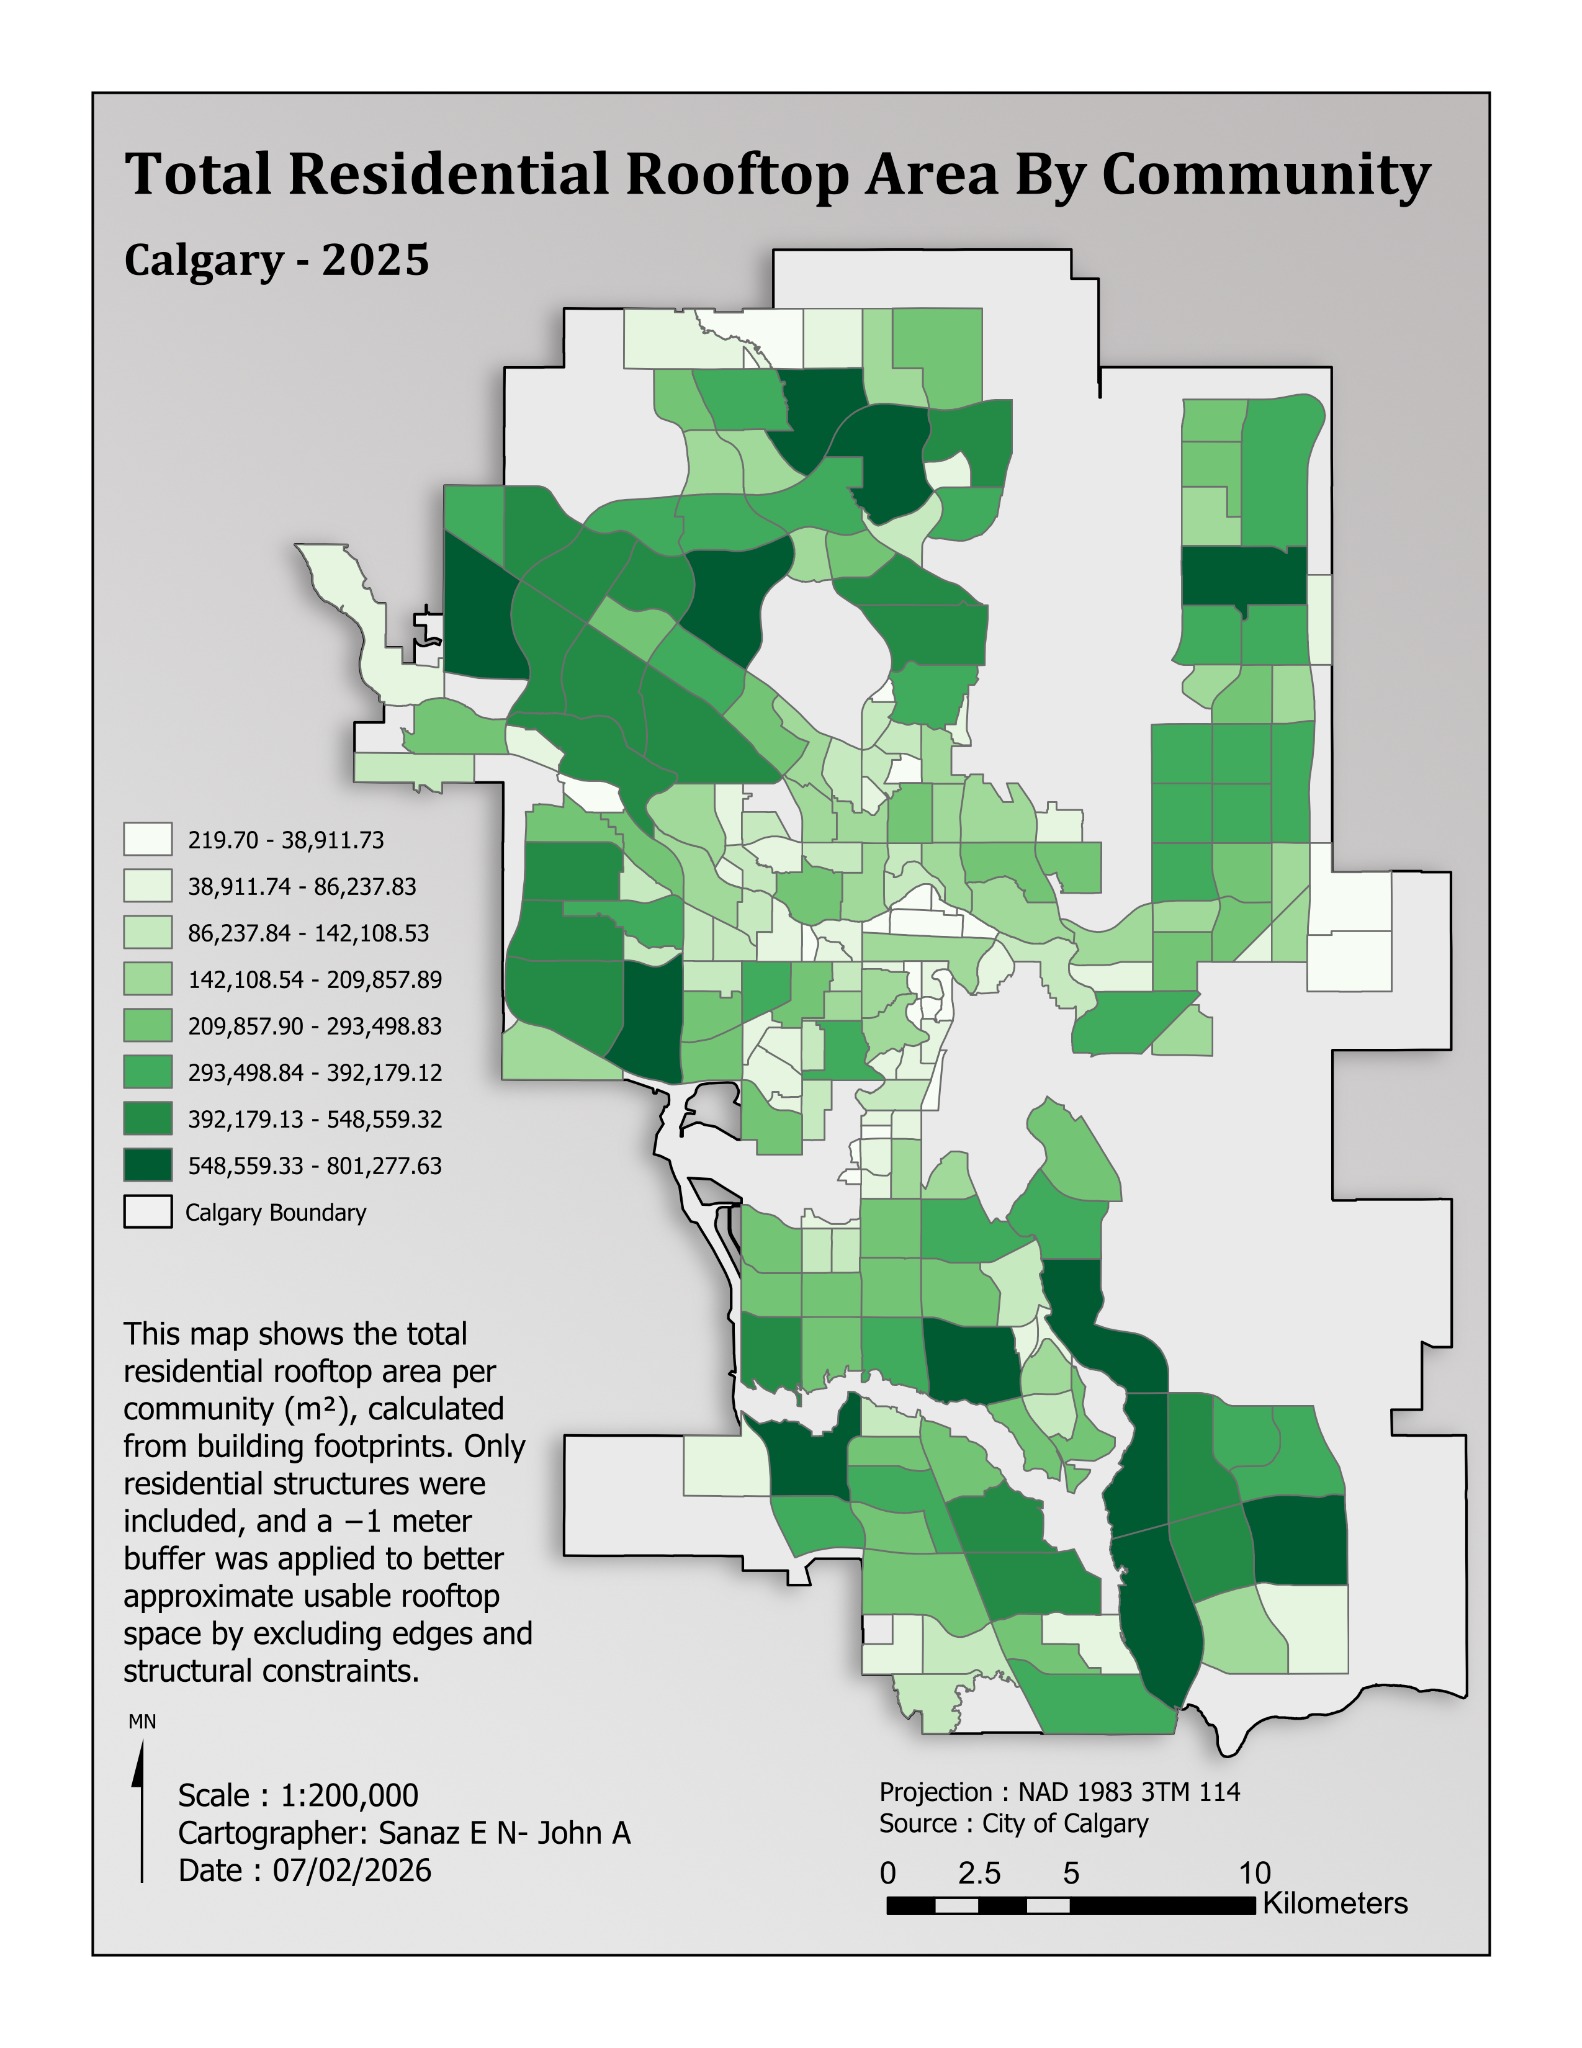
Solar & Environment
Calgary · 2025
Residential rooftop area summarized by community after footprint refinement.
Spatial aggregation
Sanaz Poroushani, John Abboud.
View project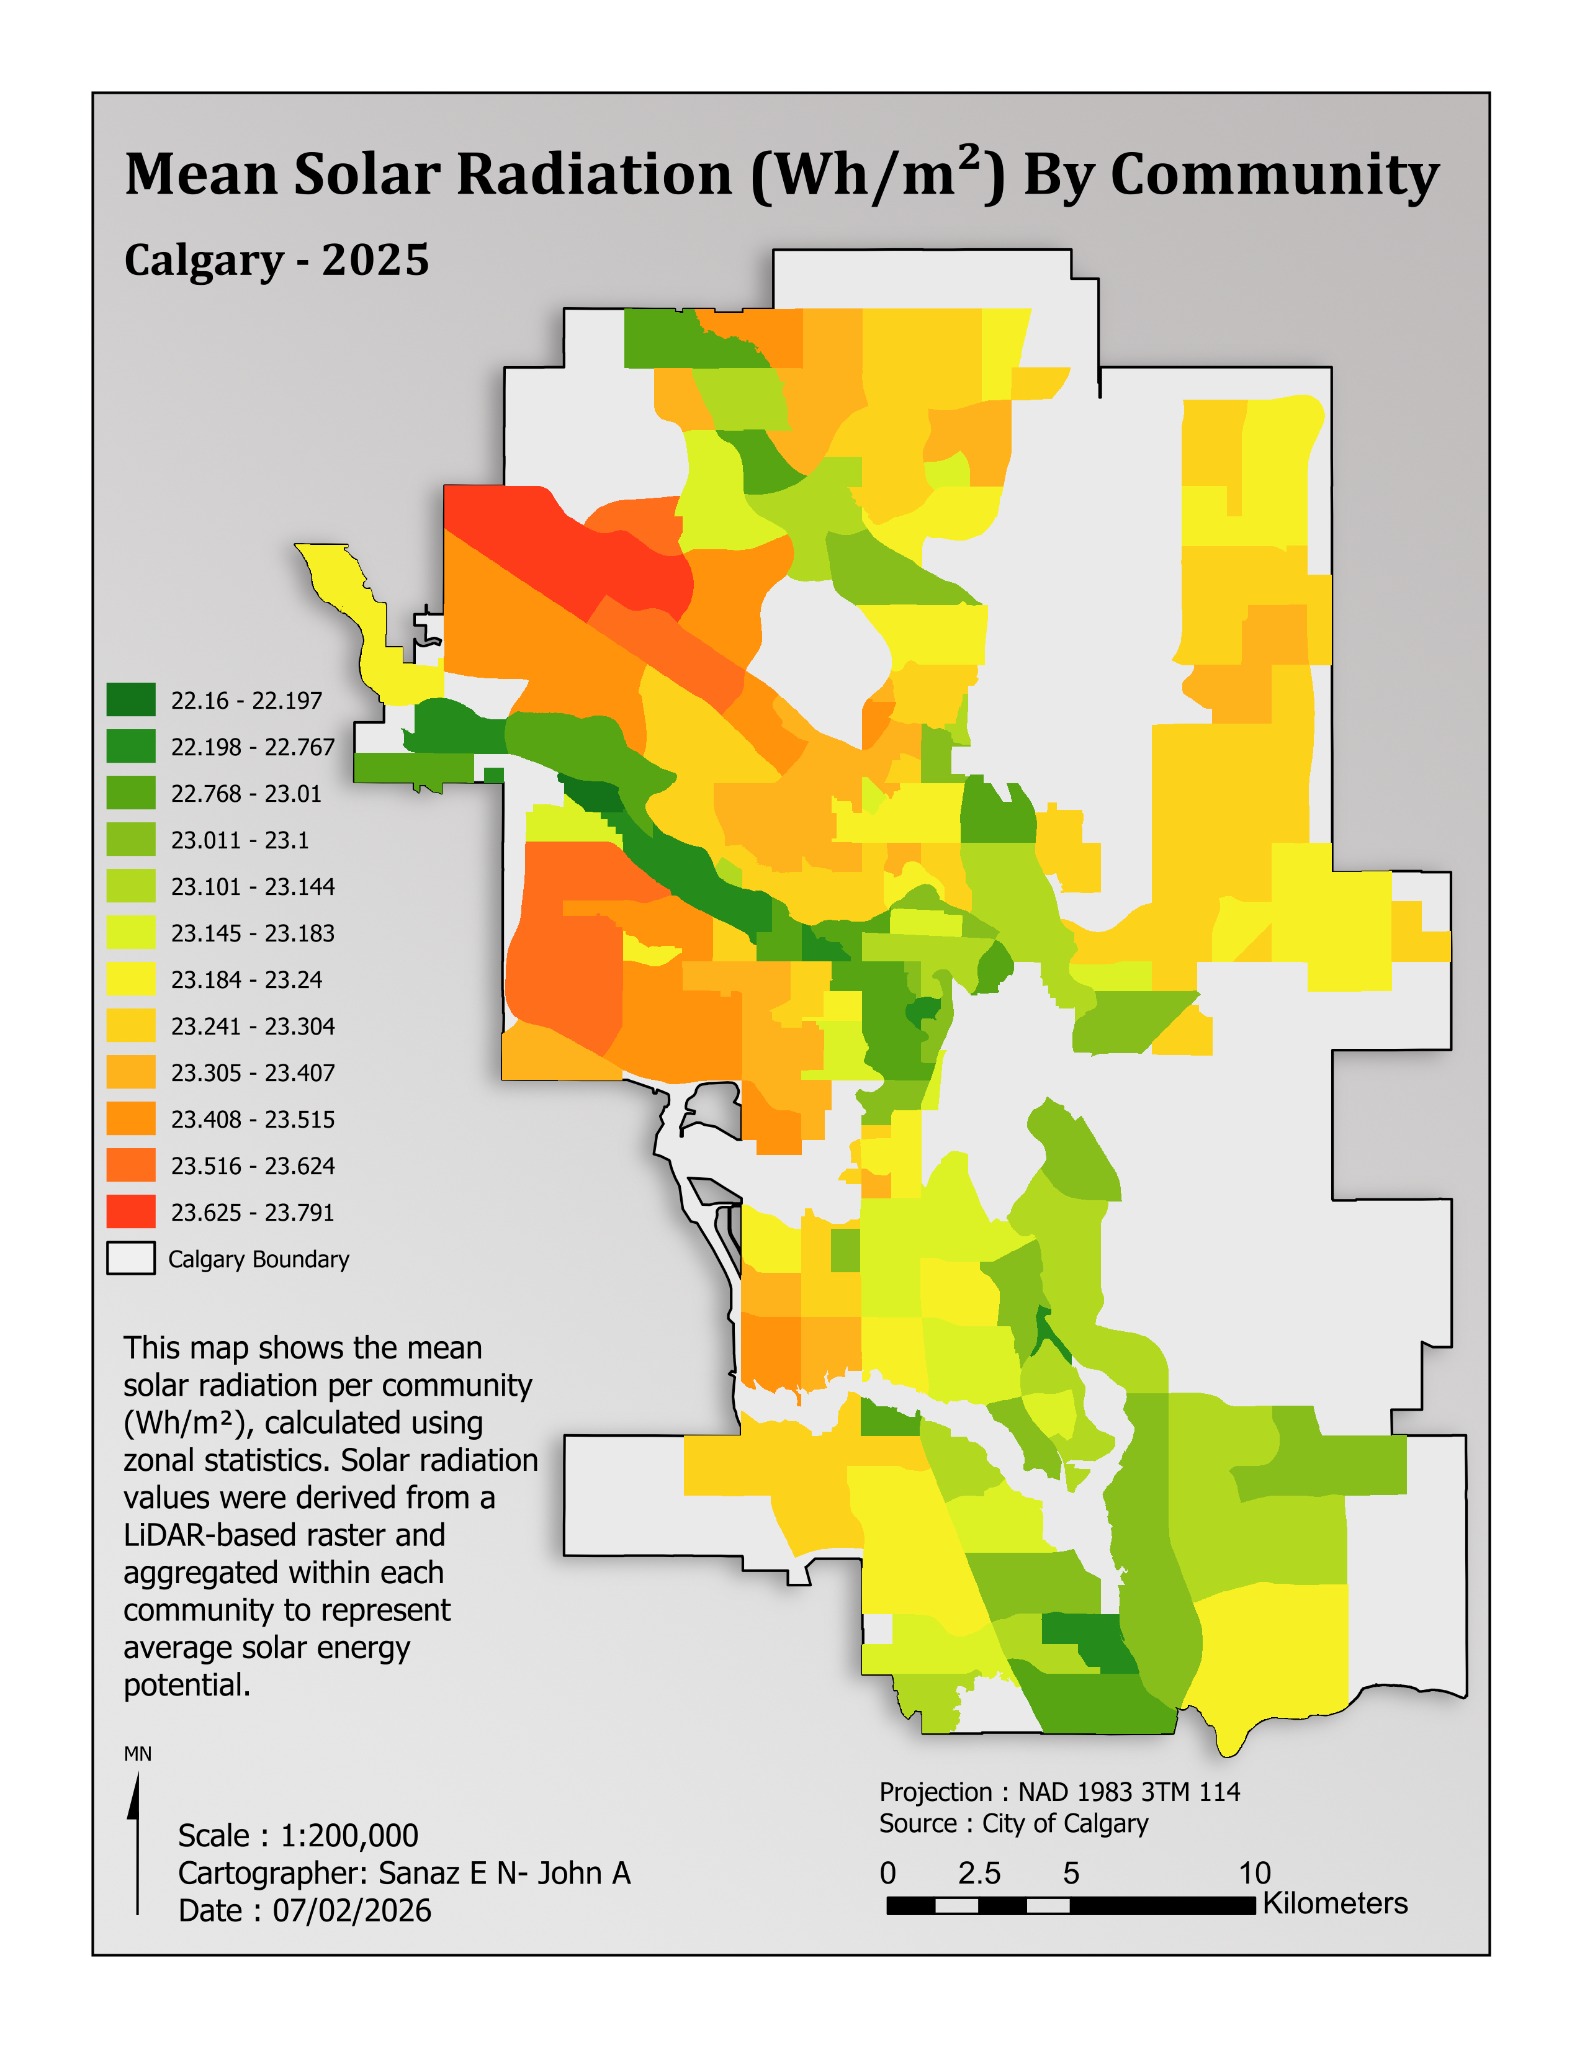
Solar & Environment
Calgary · 2025
A second solar-radiation layout with detailed classes and explicit Wh/m² units.
Zonal statistics
Sanaz Poroushani, John Abboud.
View project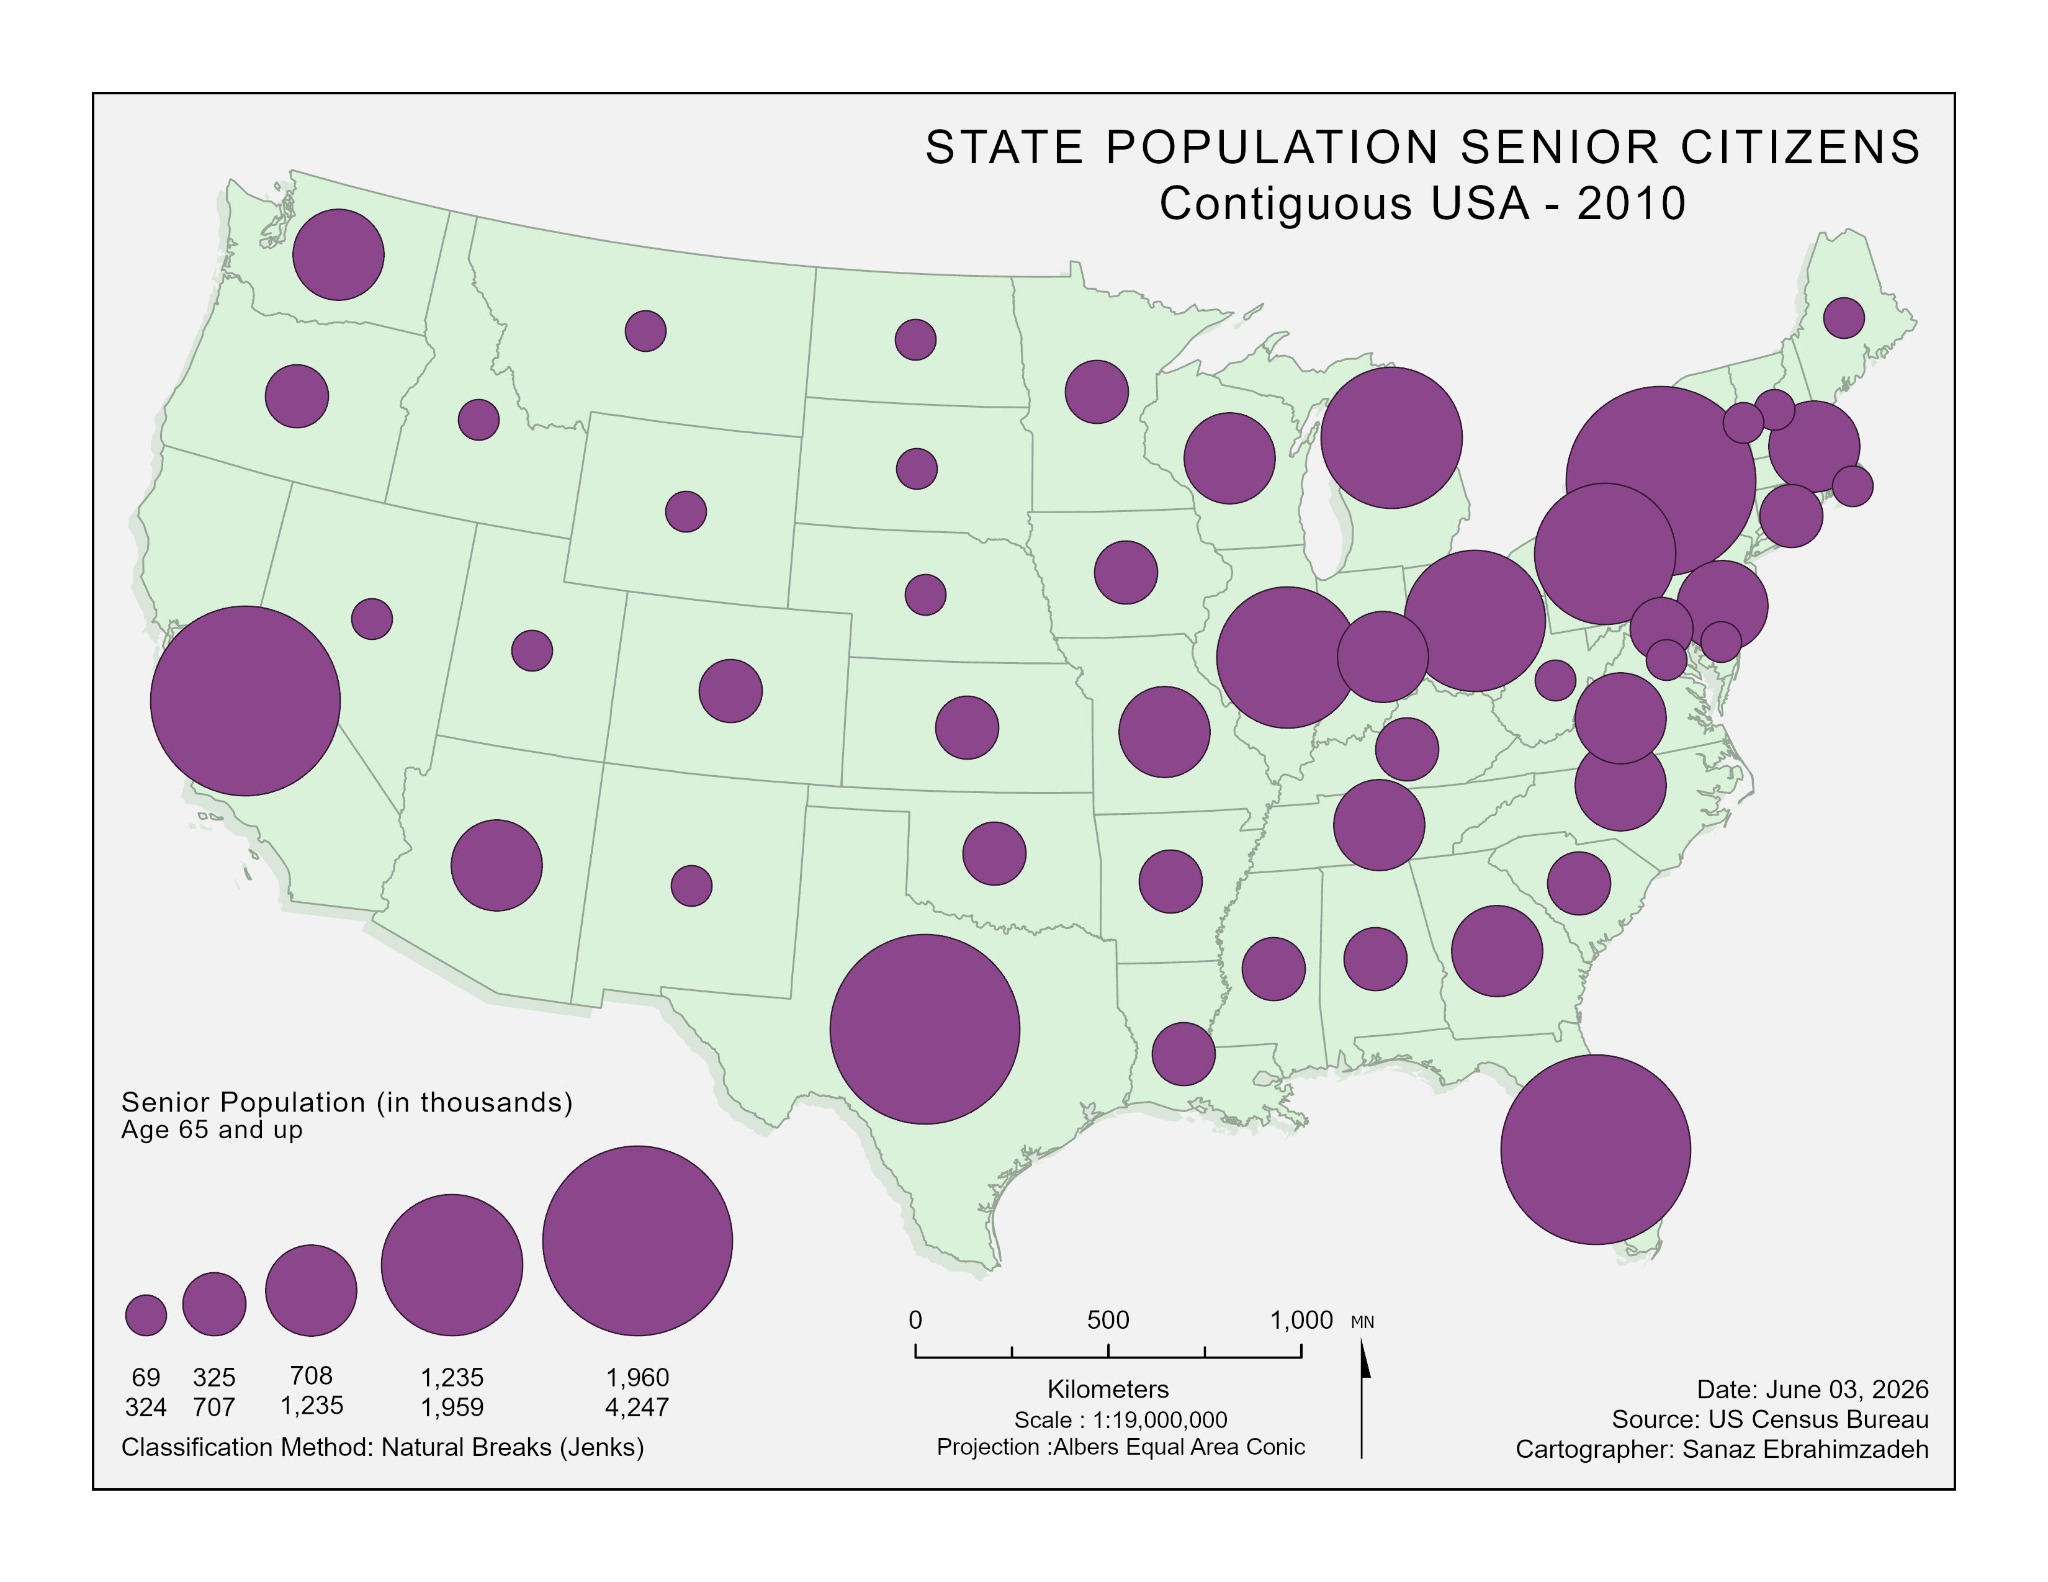
Population
Contiguous USA · 2010
State populations aged 65 and older represented with graduated circles.
Graduated symbols
Sanaz Poroushani.
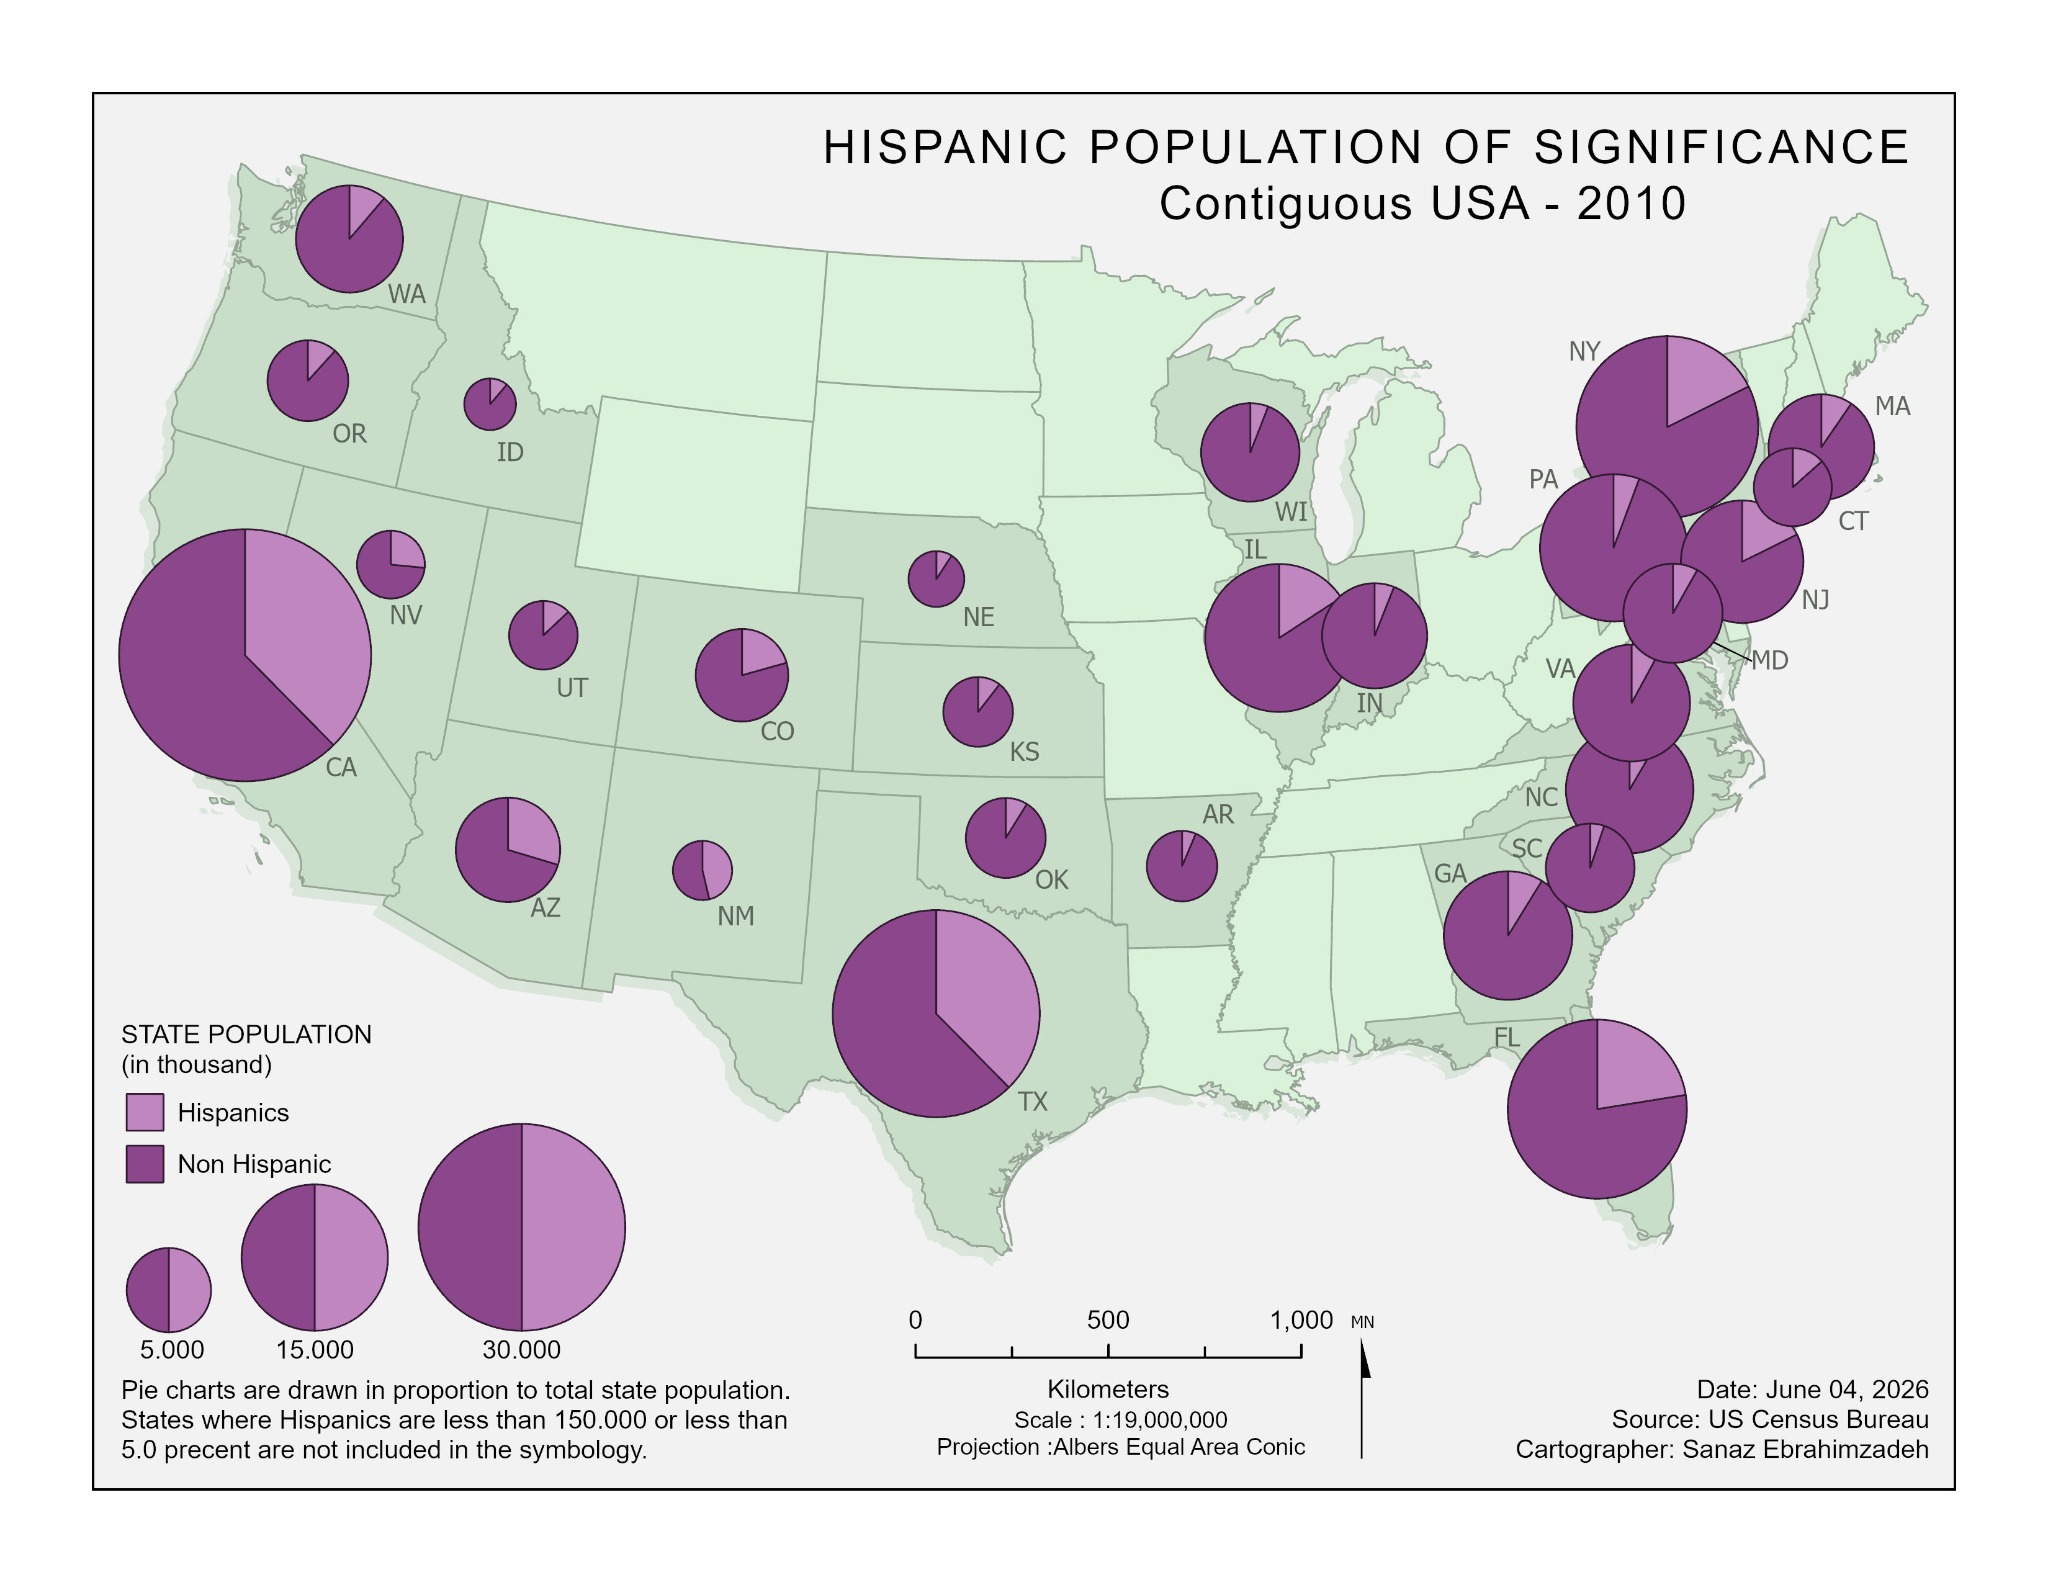
Population
Contiguous USA · 2010
Hispanic and non-Hispanic population composition represented with proportional pie symbols.
Proportional pie charts
Sanaz Poroushani.
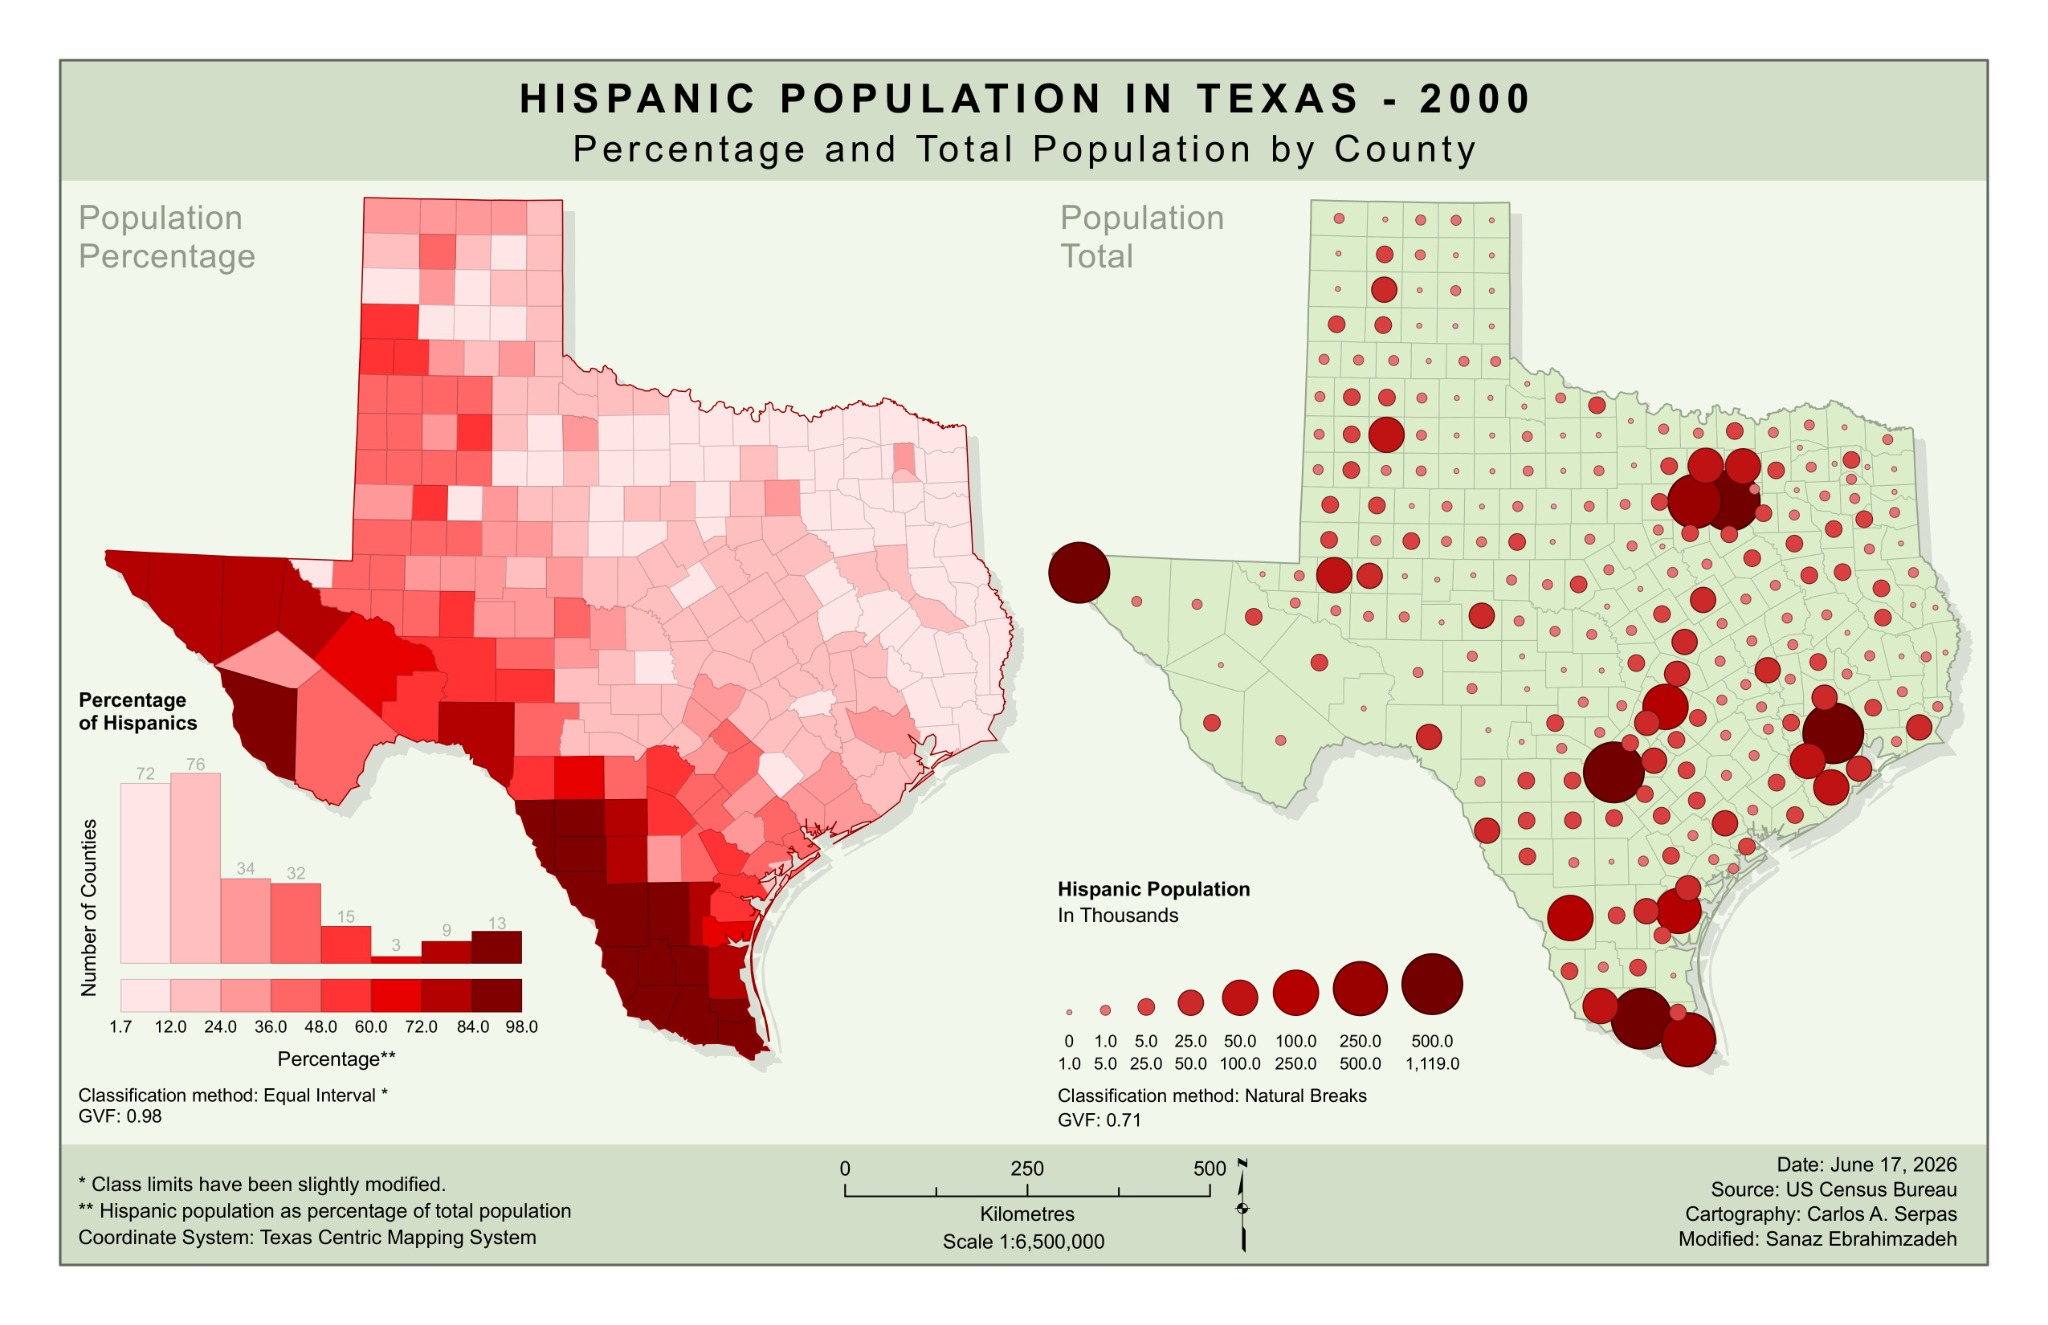
Population
Texas · 2000
A coursework adaptation comparing Hispanic population percentages with county population totals.
Choropleth & proportional symbols
Sanaz Poroushani — modifications. Original cartography: Carlos A. Serpas.
Original layouts are presented with their printed legends and credits. Collaborative maps and coursework adaptations are credited in the captions.