
Spatial analysis
Where the Sun Shines and Income Aligns
Combining LiDAR, roof area, solar radiation, and household income to compare Calgary communities.
- Role
- GIS analyst
- Project
- SAIT BGIS / Calgary rooftop solar study
My contribution
Sanaz Poroushani — GIS analyst. I contributed to the community-level solar suitability analysis, spatial statistics, data and topology QA/QC, map production, and project reporting. The report’s QA/QC checklist records my review of spatial analysis, attribute data, topology, and deliverables, alongside collaborative review of the ModelBuilder workflow.
01 / Introduction
A GIS-Based Neighborhood Analysis of Rooftop Solar Potential in Calgary
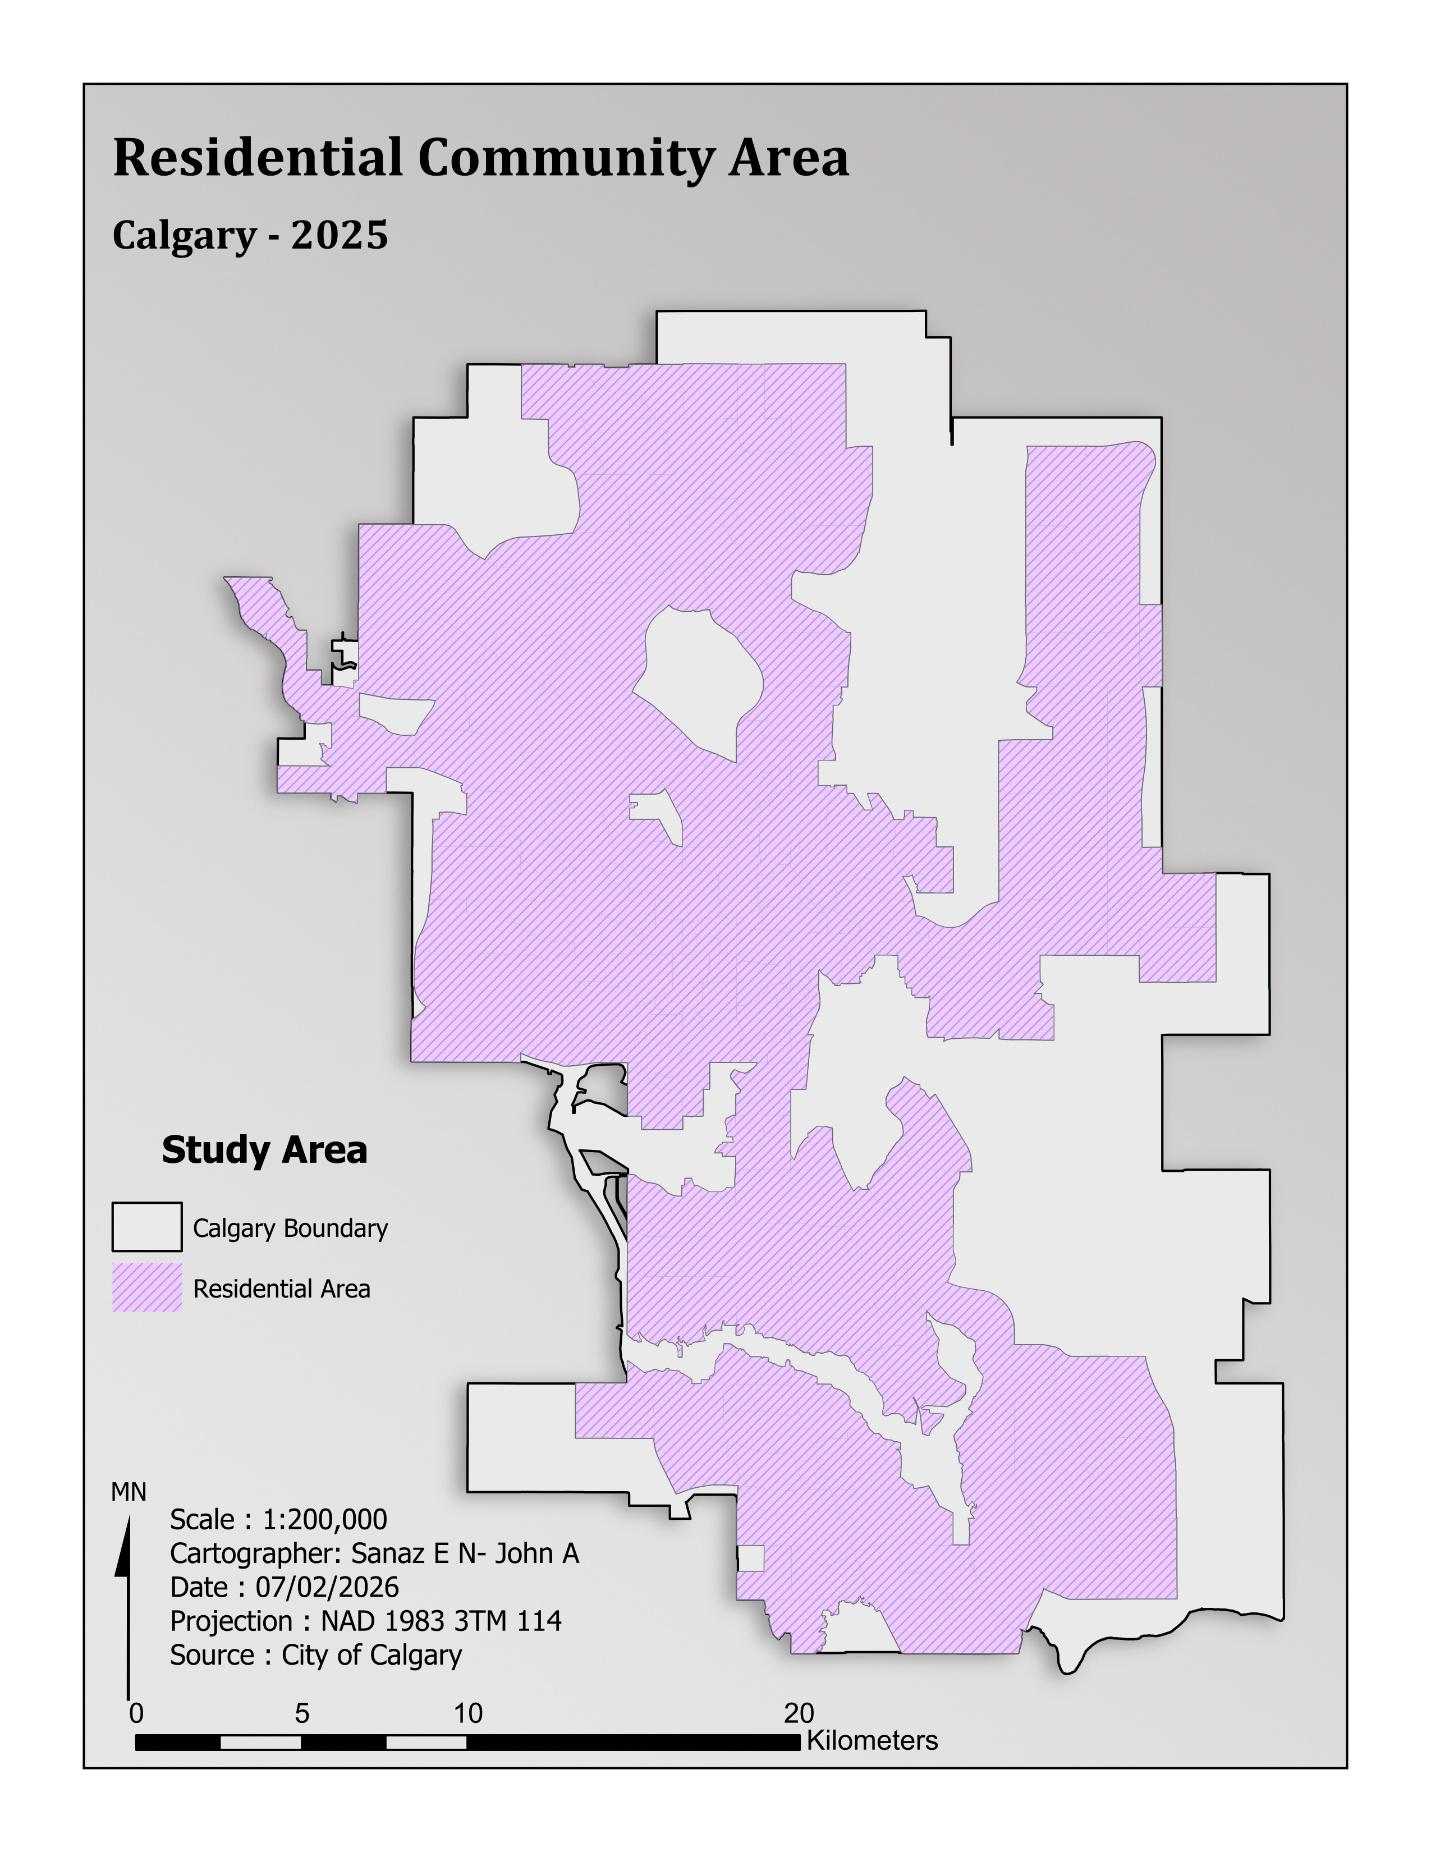
Where are Calgary’s strongest opportunities for rooftop solar when physical potential and socioeconomic capacity are considered together? This study combines LiDAR-derived solar radiation, residential rooftop area, and median household income to compare communities and identify priority areas for further investigation.
Geographic questionWhere are the best neighborhoods in Calgary for rooftop solar panel installation based on solar potential, rooftop suitability, and socioeconomic factors such as household income?
Three dimensions of suitability
- Technical potential: incoming solar radiation derived from a two-metre LiDAR DEM.
- Physical capacity: available residential rooftop area aggregated by community.
- Socioeconomic readiness: median household income from Esri Enrich.
The analysis integrates these dimensions into a relative suitability index and uses bivariate mapping to explore where solar potential and household income align. Income is a community-level proxy for adoption capacity, rather than a measure of individual willingness to install solar.
Research context
The literature review identified the value of combining LiDAR and GIS for technical rooftop assessment with socioeconomic information about adoption. The project addresses this at the Calgary community scale, bringing technical resources and financial capacity into the same planning framework.
02 / Data preparation & analysis
From source data to community indicators
| Input | Role in the study | Source |
|---|---|---|
| Community boundaries | Common unit for aggregating and comparing results | City of Calgary Open Data |
| Residential building footprints | Estimate rooftop capacity and total available area | City of Calgary Open Data |
| Two-metre LiDAR DEM | Generate the solar radiation surface | City of Calgary Open Data |
| Median household income | Represent socioeconomic capacity at community level | Esri Enrich |
Data management and QA/QC
The layers were organized in a file geodatabase and projected to NAD 1983 3TM Zone 114. Data preparation checked missing values, duplicate records, geometry, unnecessary attributes, and community identifiers. Topology validation checked polygon overlaps and gaps before analysis. The same coordinate reference was maintained in PostgreSQL/PostGIS using SRID 3776.
Solar radiation and usable rooftop area
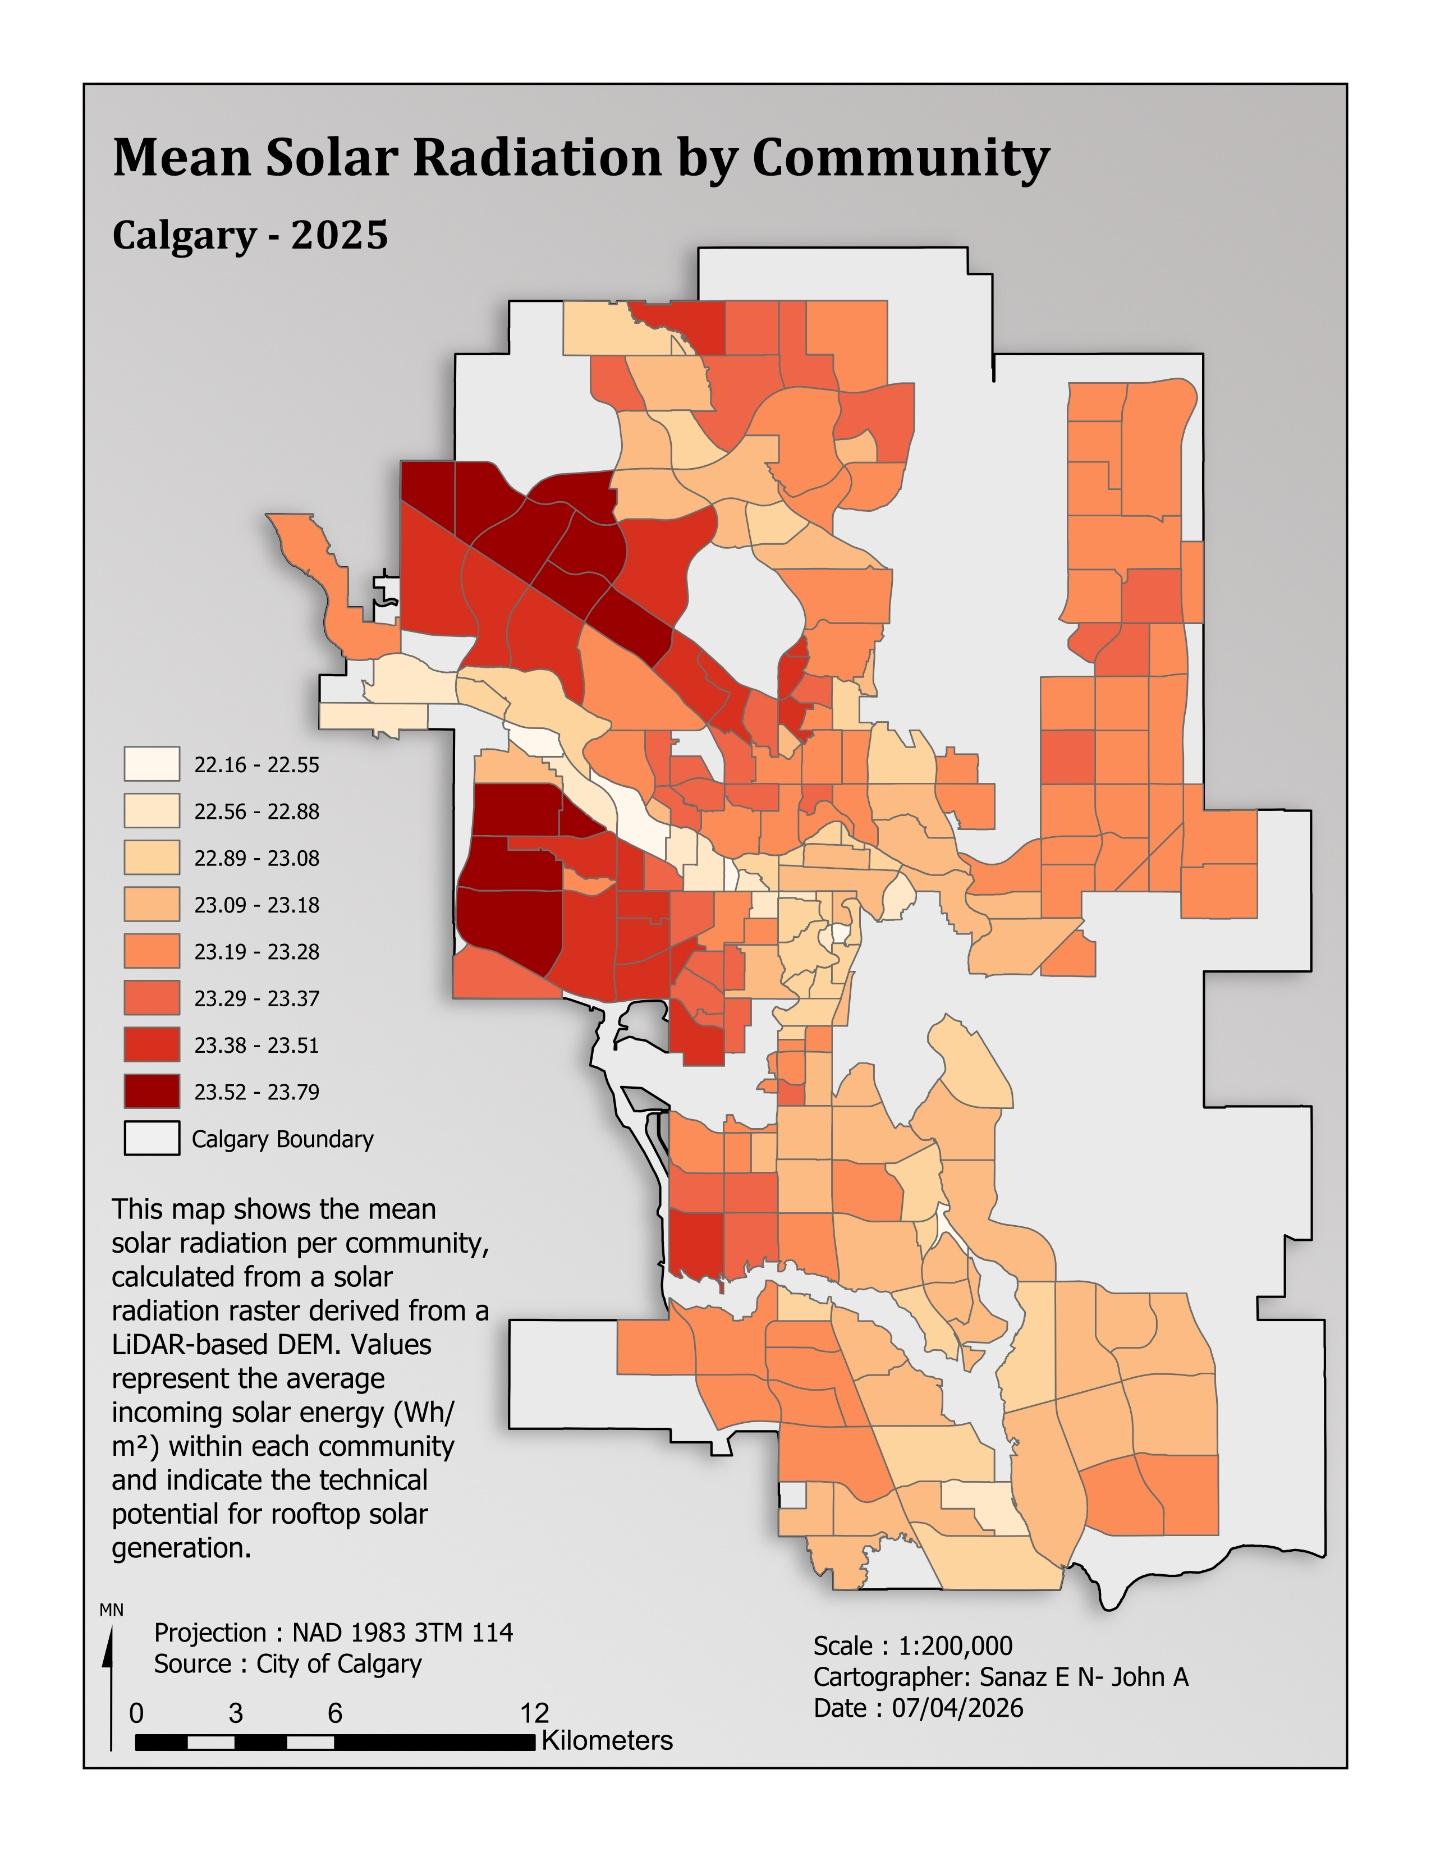
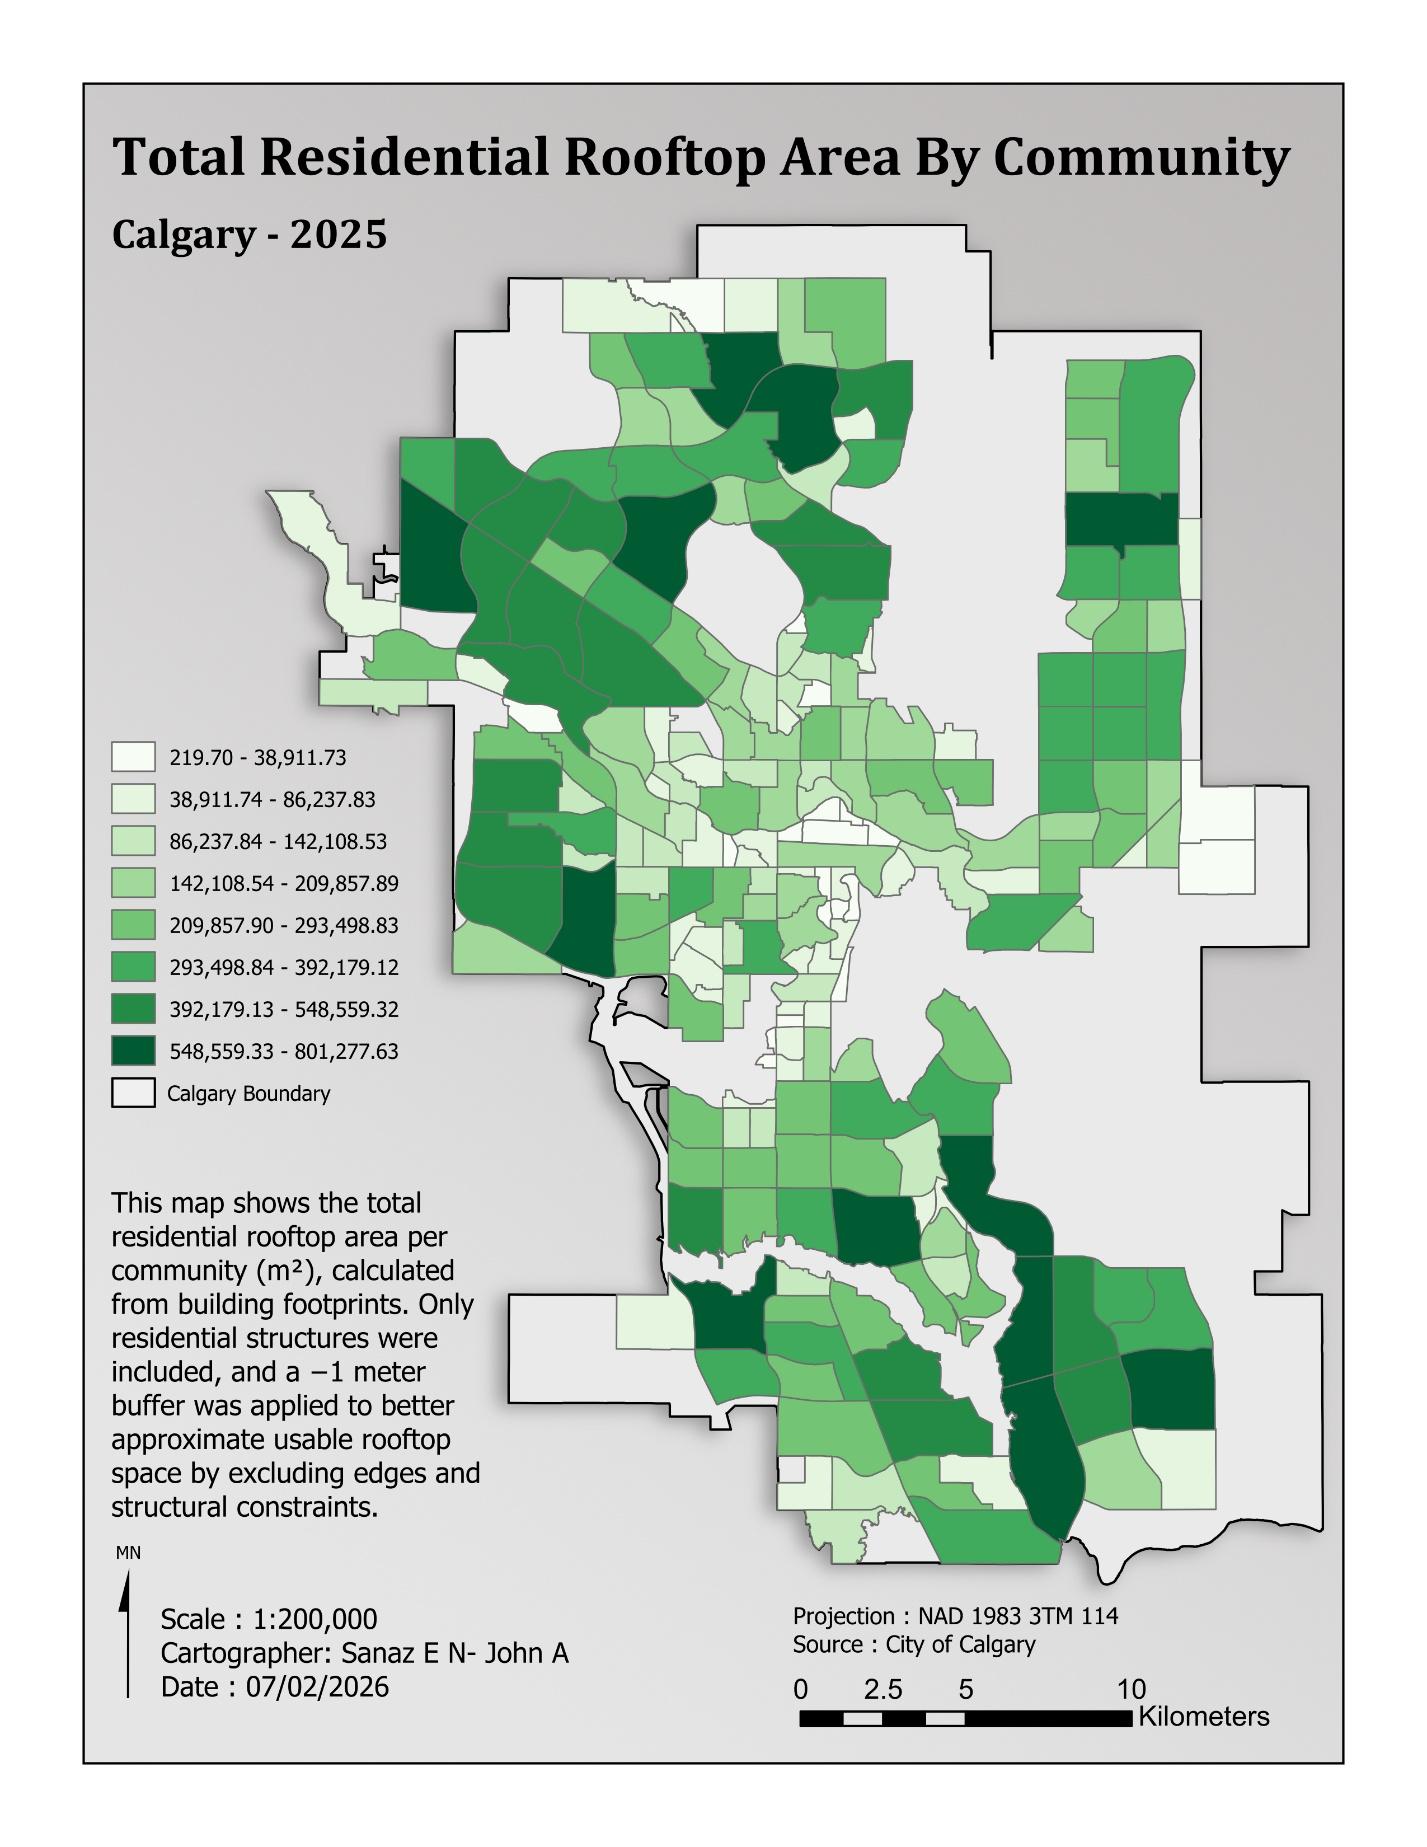
A solar radiation surface was generated in ArcGIS Pro from the DEM, with radiation expressed in Wh/m². Residential building footprints were filtered, clipped to the study area, and refined with a negative one-metre buffer to approximate usable rooftop space. The report’s SQL implementation of this buffer is included below.
Zonal Statistics as Table summarized solar radiation within each community. Spatial aggregation calculated total residential rooftop area. Solar statistics, rooftop area, and income were joined through the common comm_code field.
Composite suitability index
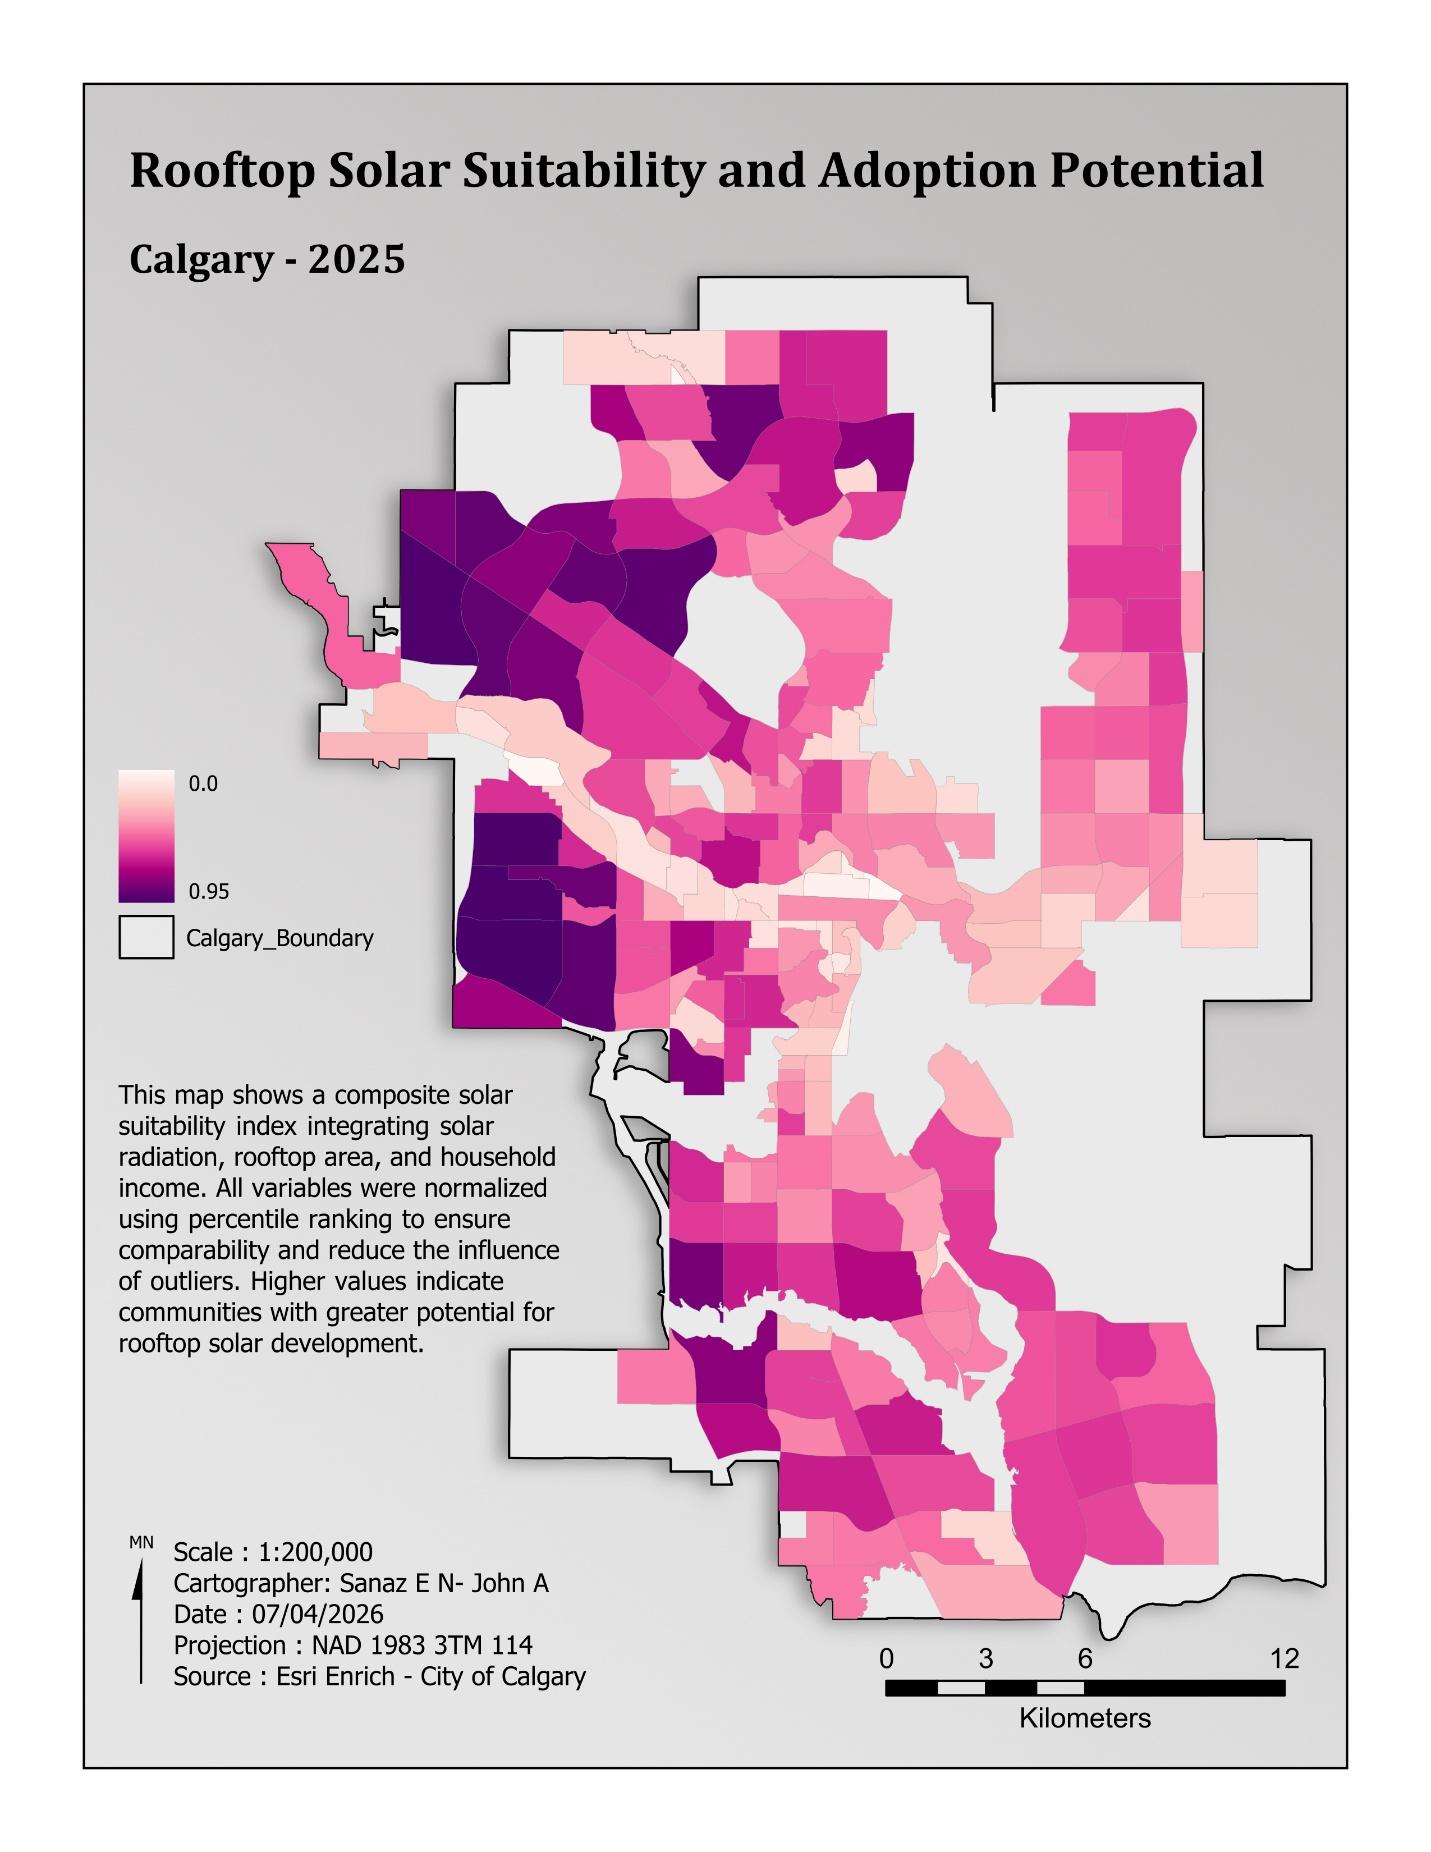
The main ArcGIS analysis used the Calculate Composite Index tool. Mean solar radiation (Solar_MEAN), total residential rooftop area (BL_Area_Sum), and median household income (Household_Mid_Income) were standardized using percentile ranking and combined using the geometric mean. This balances the inputs: a low value in one dimension cannot be fully offset by a high value in another.
Estimated photovoltaic energy production
The report estimates PV output as rooftop area × mean solar radiation × 0.15, then divides by 1,000 to convert Wh to kWh. The 0.15 factor combines approximately 20% panel efficiency and a 75% system performance ratio. This is a screening estimate based on the report’s input period and assumptions; building-level installation decisions require site-specific assessment.
03 / Reproducible geoprocessing
ModelBuilder workflow
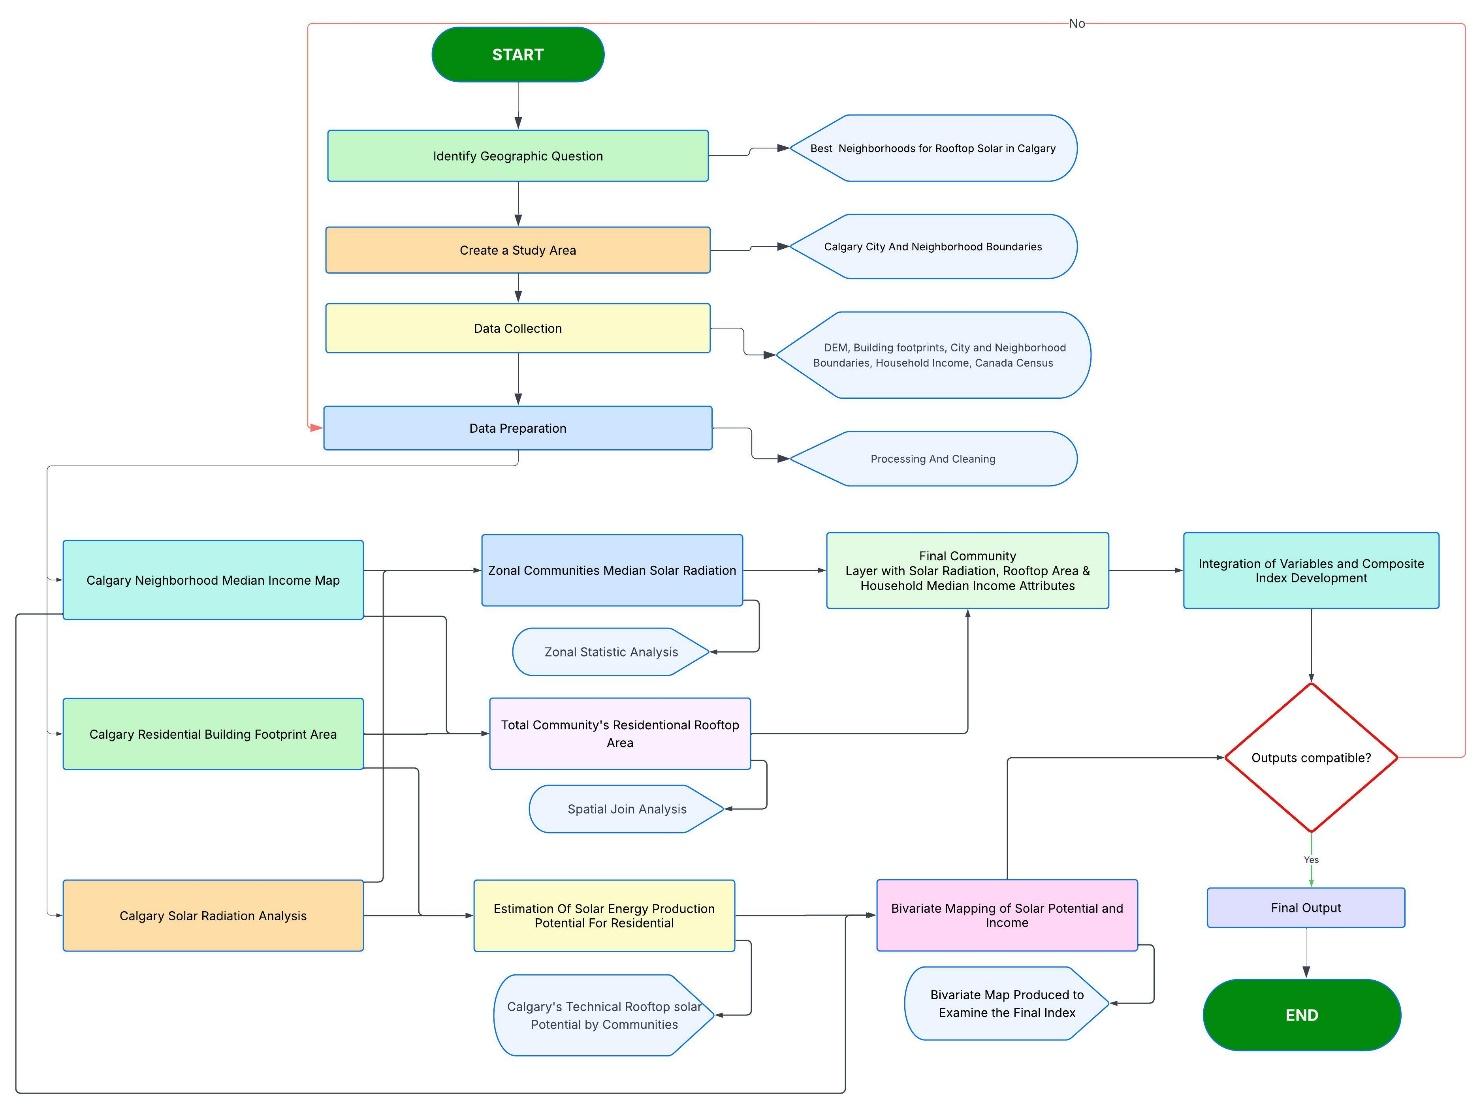
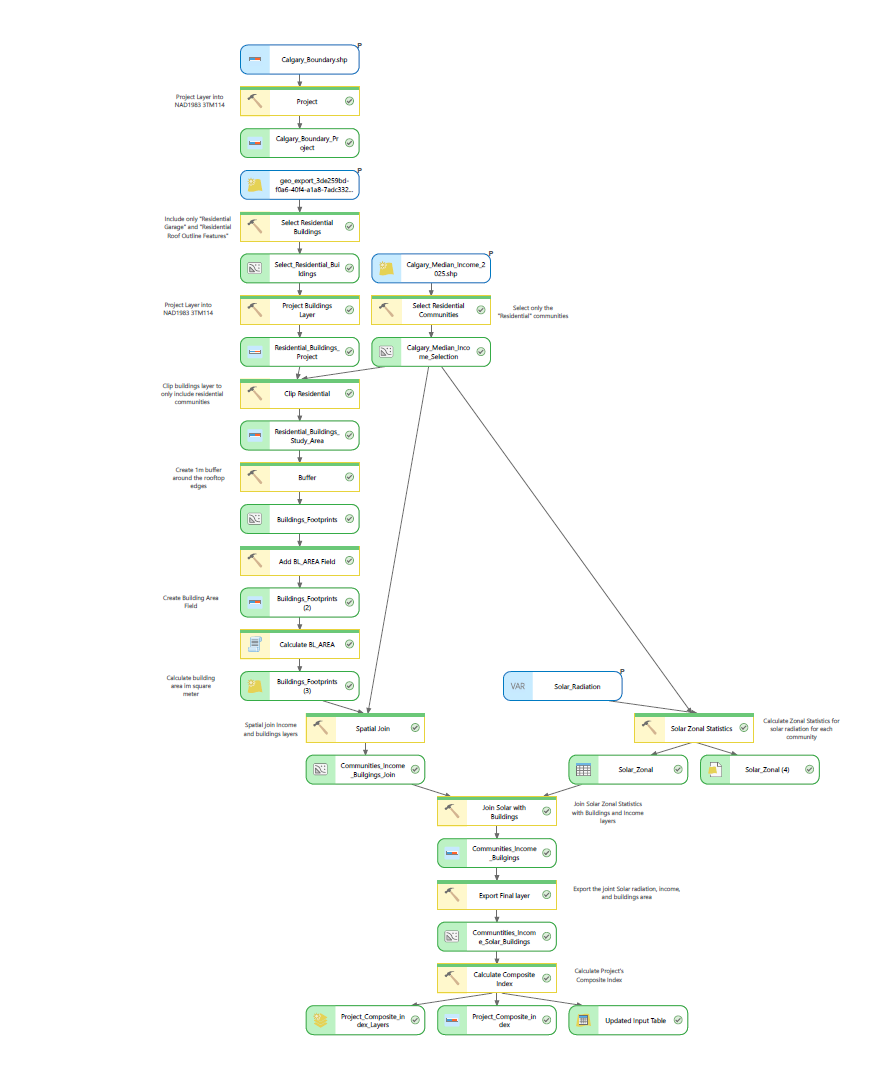
The ArcGIS ModelBuilder model organizes community selection, residential building extraction, clipping, footprint buffering, area calculation, income integration, zonal statistics, and composite index calculation into a repeatable workflow.
Preprocessed solar radiation and completed Esri Enrich income data were used in the model to reduce repeated computation and credit usage. Model outputs were exported to Model_Builder_DG.gdb, separately from previously processed data in Final_Geodatabase.gdb.
04 / Results & cartography
Where solar potential and income align
Solar radiation was relatively consistent across Calgary compared with the variation in rooftop area and income. The composite results identify western and southwestern communities as prominent opportunities, reflecting the combined effect of physical capacity and socioeconomic readiness.
Communities highlighted in the report
Edgemont, Hawkwood, Scenic Acres, Tuscany, Royal Oak, West Springs, Signal Hill, Strathcona Park, Aspen Woods, and Springbank Hill are identified among the most suitable communities. These names are presented as the report’s highlighted group, without imposing an additional ranking.
Bivariate analysis
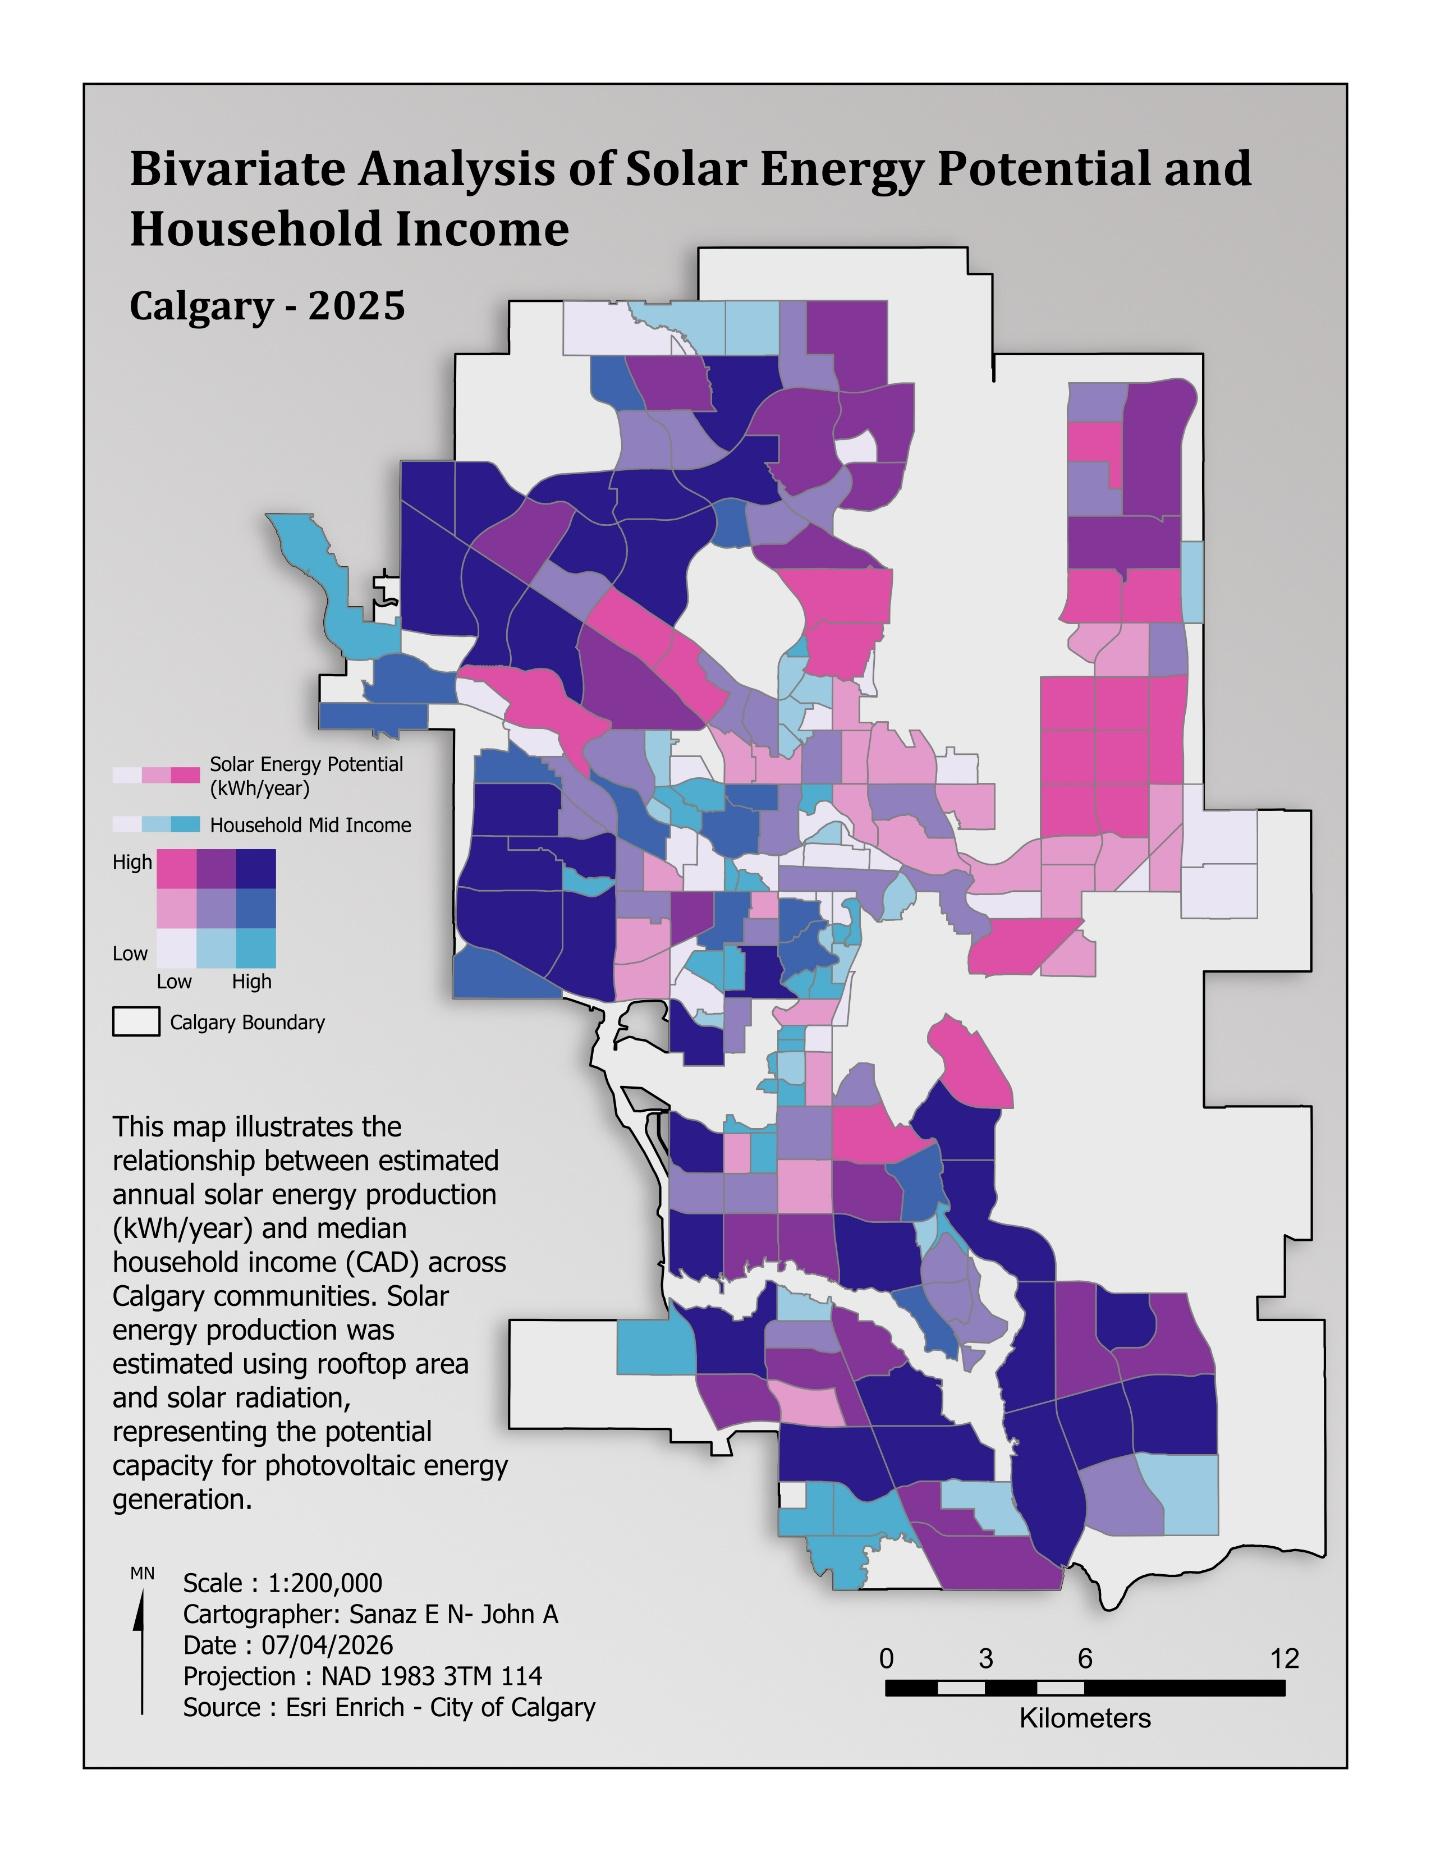
The bivariate map combines estimated solar energy potential and median household income. It distinguishes communities with both high potential and high income from those where strong technical potential coincides with lower income and possible financial barriers. The report identifies agreement between the composite and bivariate results in communities including Edgemont, Tuscany, West Springs, Aspen Woods, and Springbank Hill.
05 / Statistical interpretation
Income patterns and spatial clustering
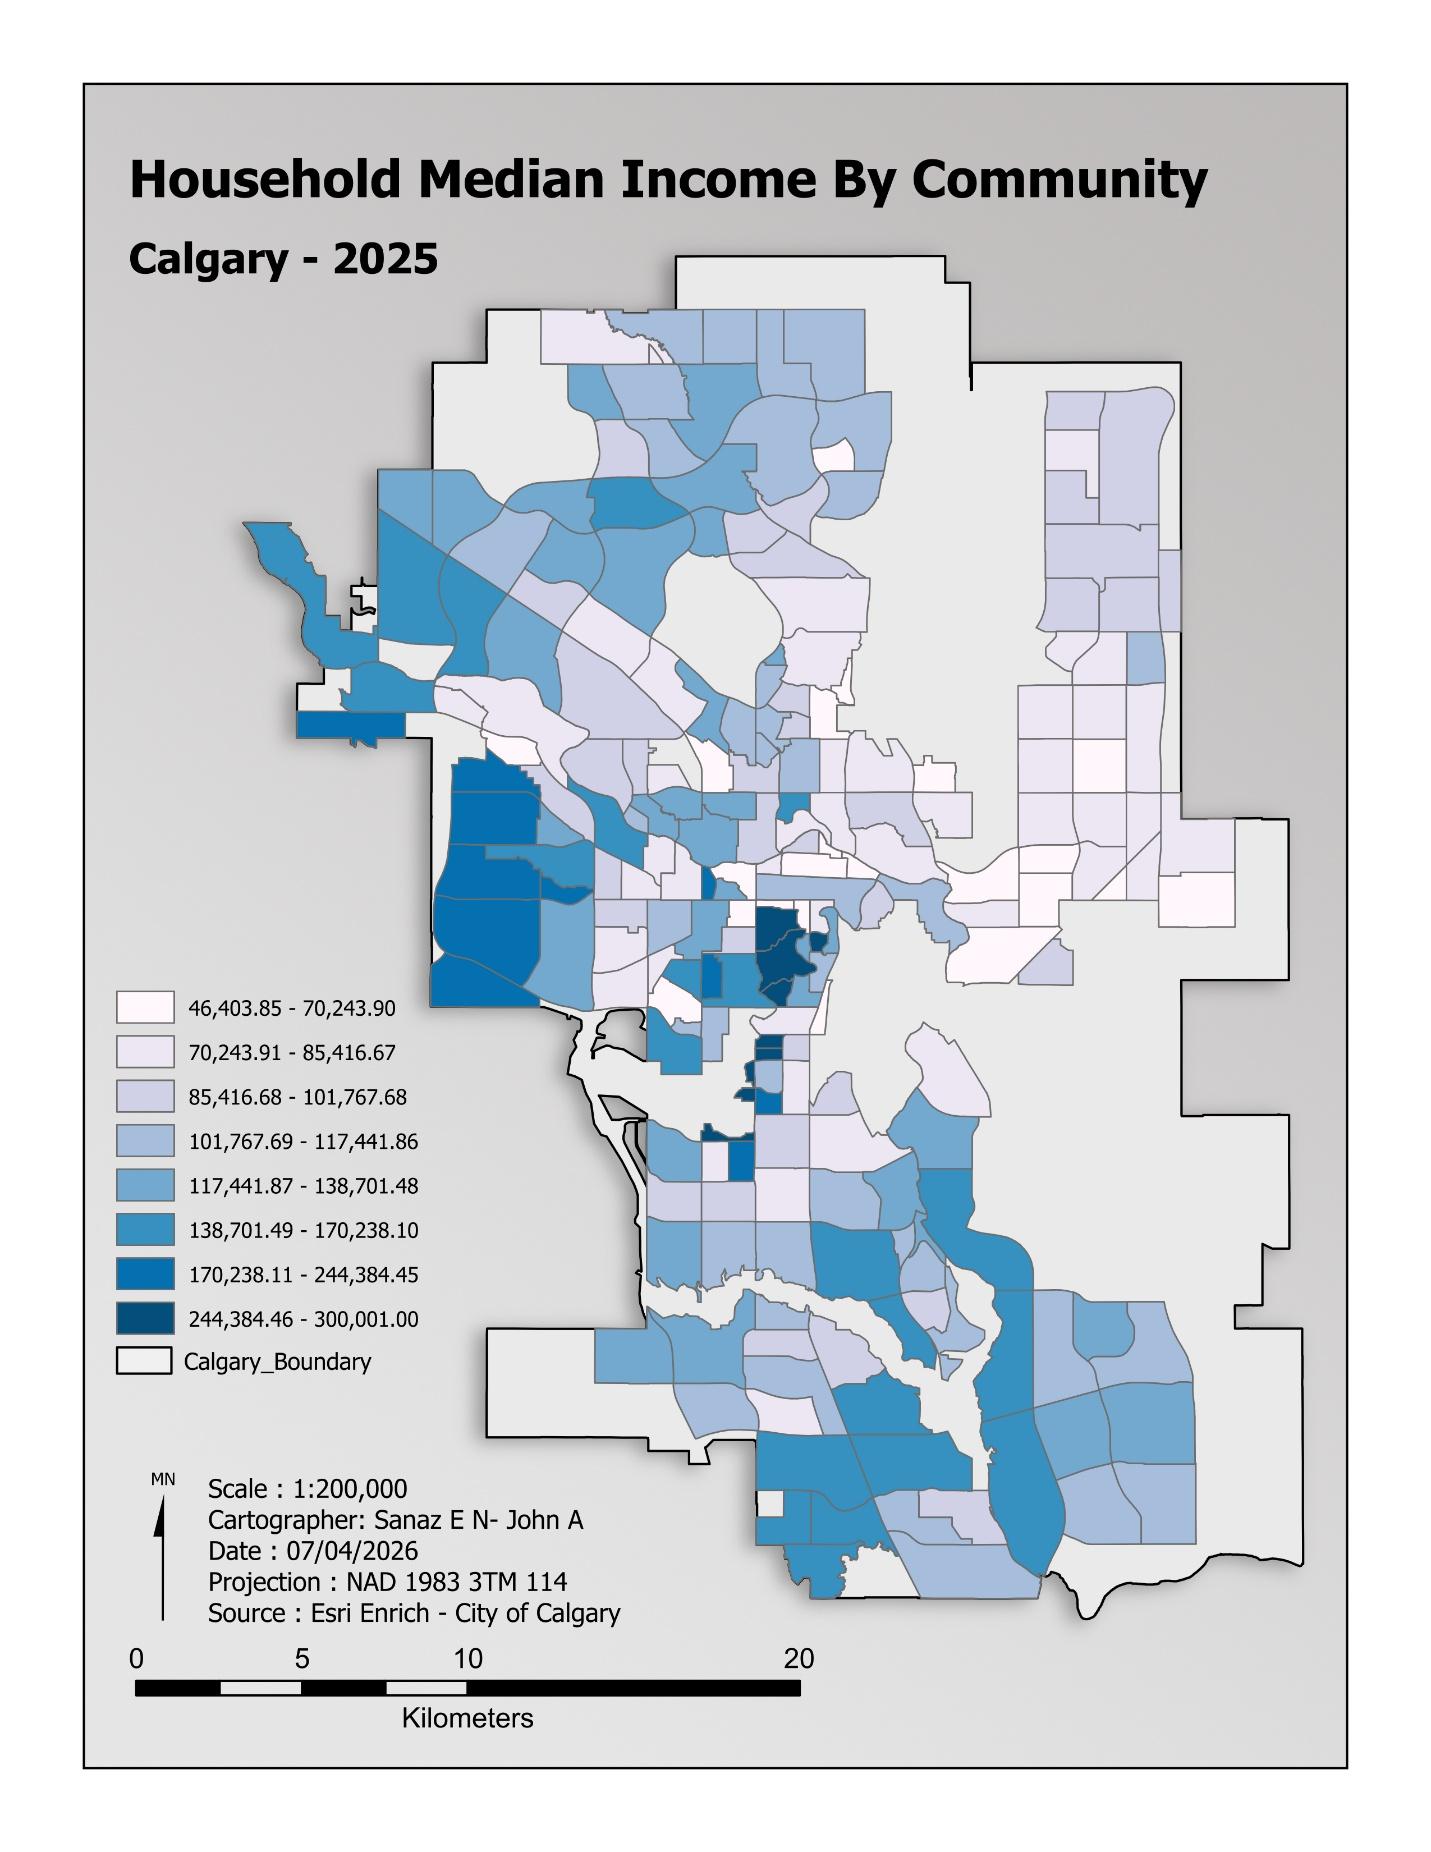
Community median household incomes showed a positively skewed distribution. The mean was $114,529.89, compared with a median of $106,125.62; community values ranged from $46,403.85 to $300,001.00. The report’s standard deviation of $49,736.37 and skewness of 2.06 describe substantial variation between communities.
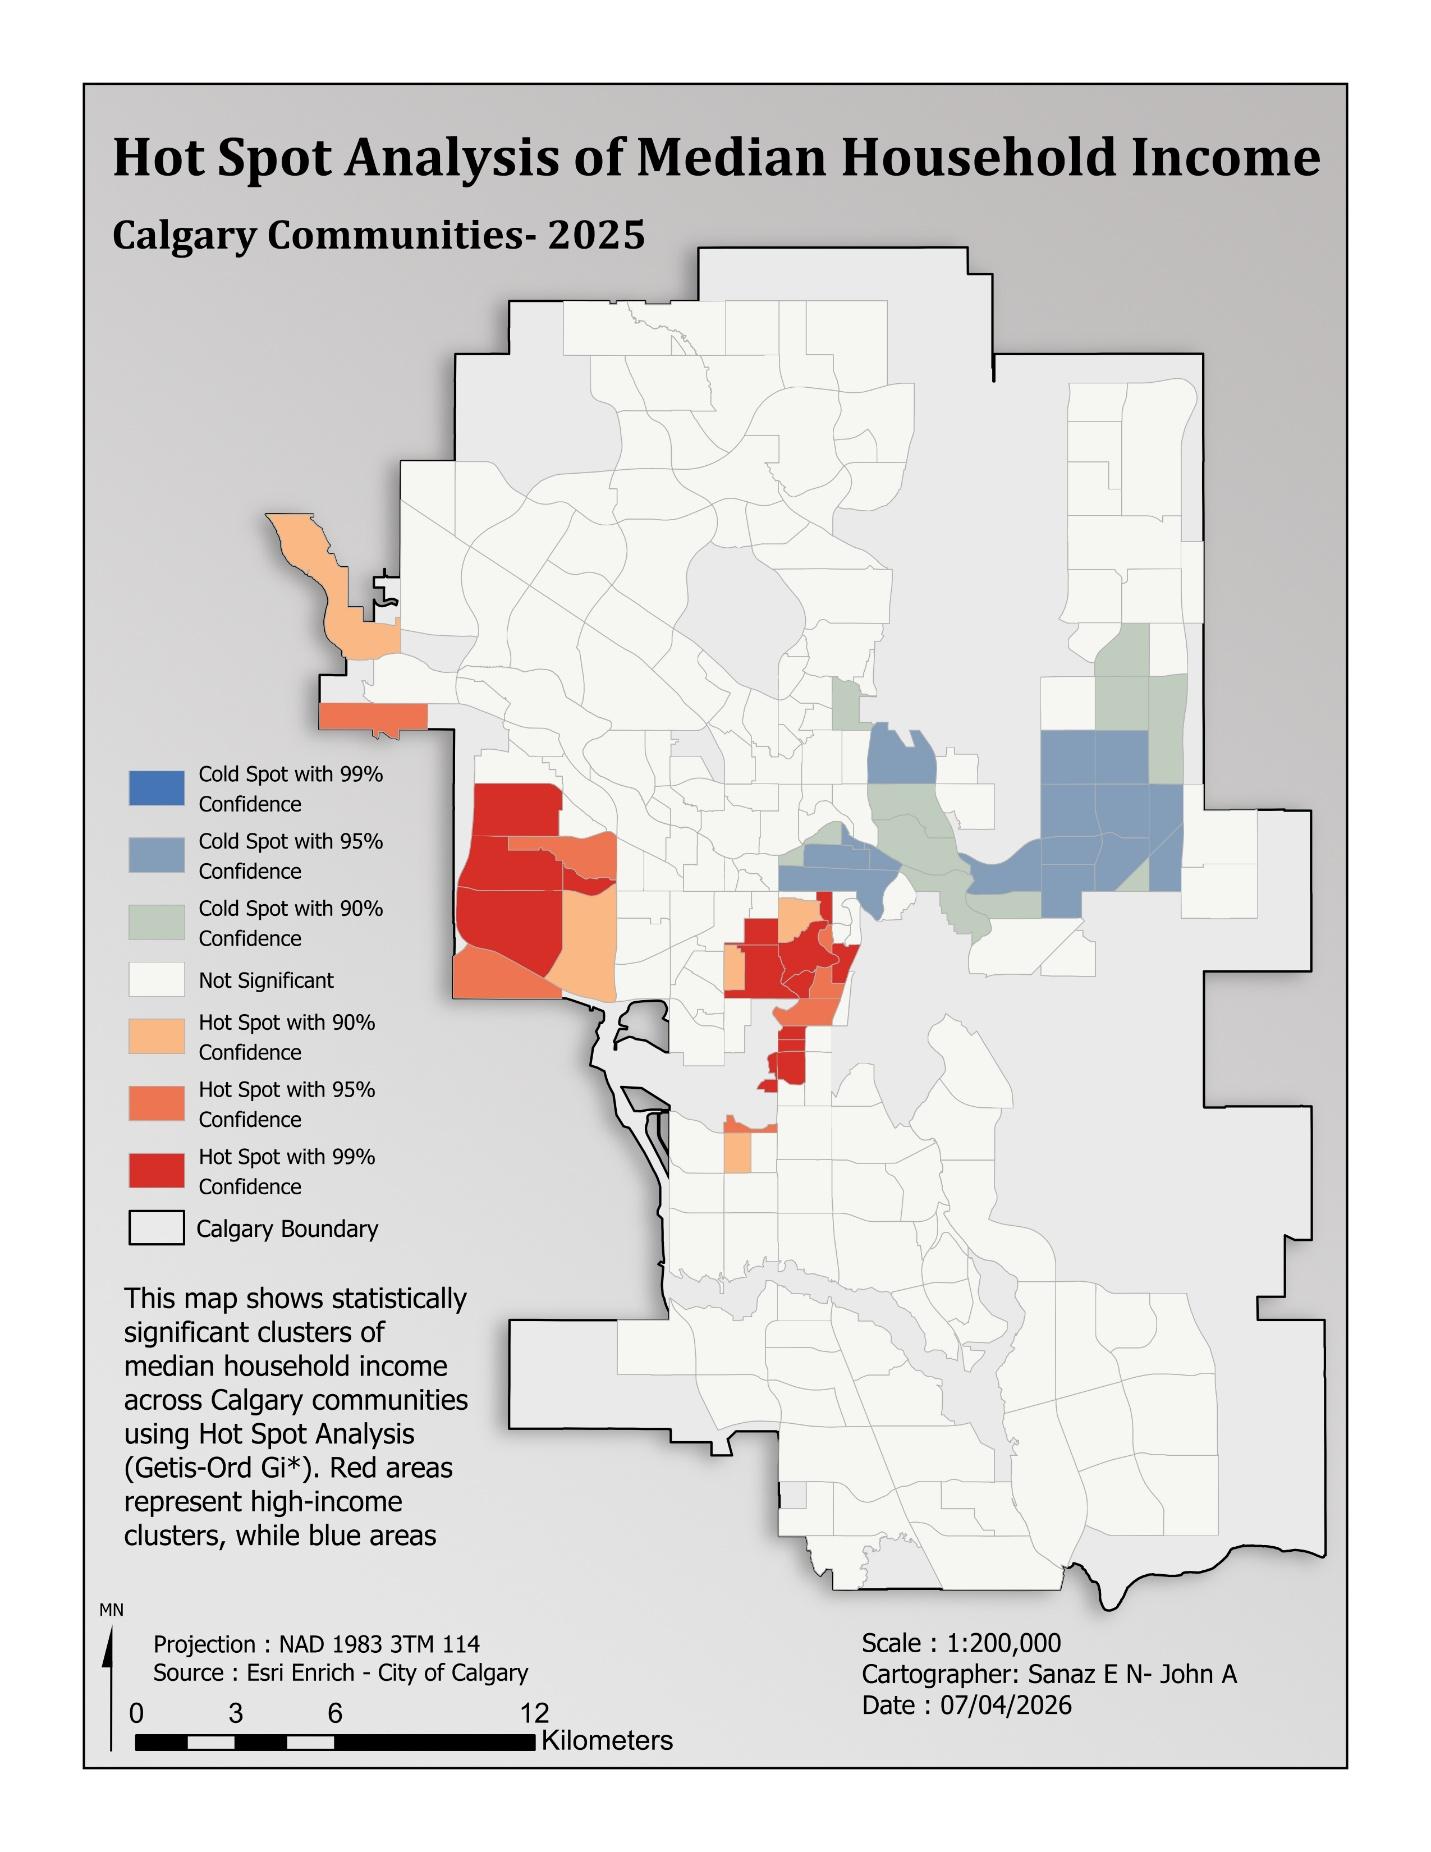
Hot Spot Analysis — Getis-Ord Gi*
The income hotspot analysis identifies concentrations of high and low values. These patterns provide context for interpreting adoption capacity and the composite solar suitability map.
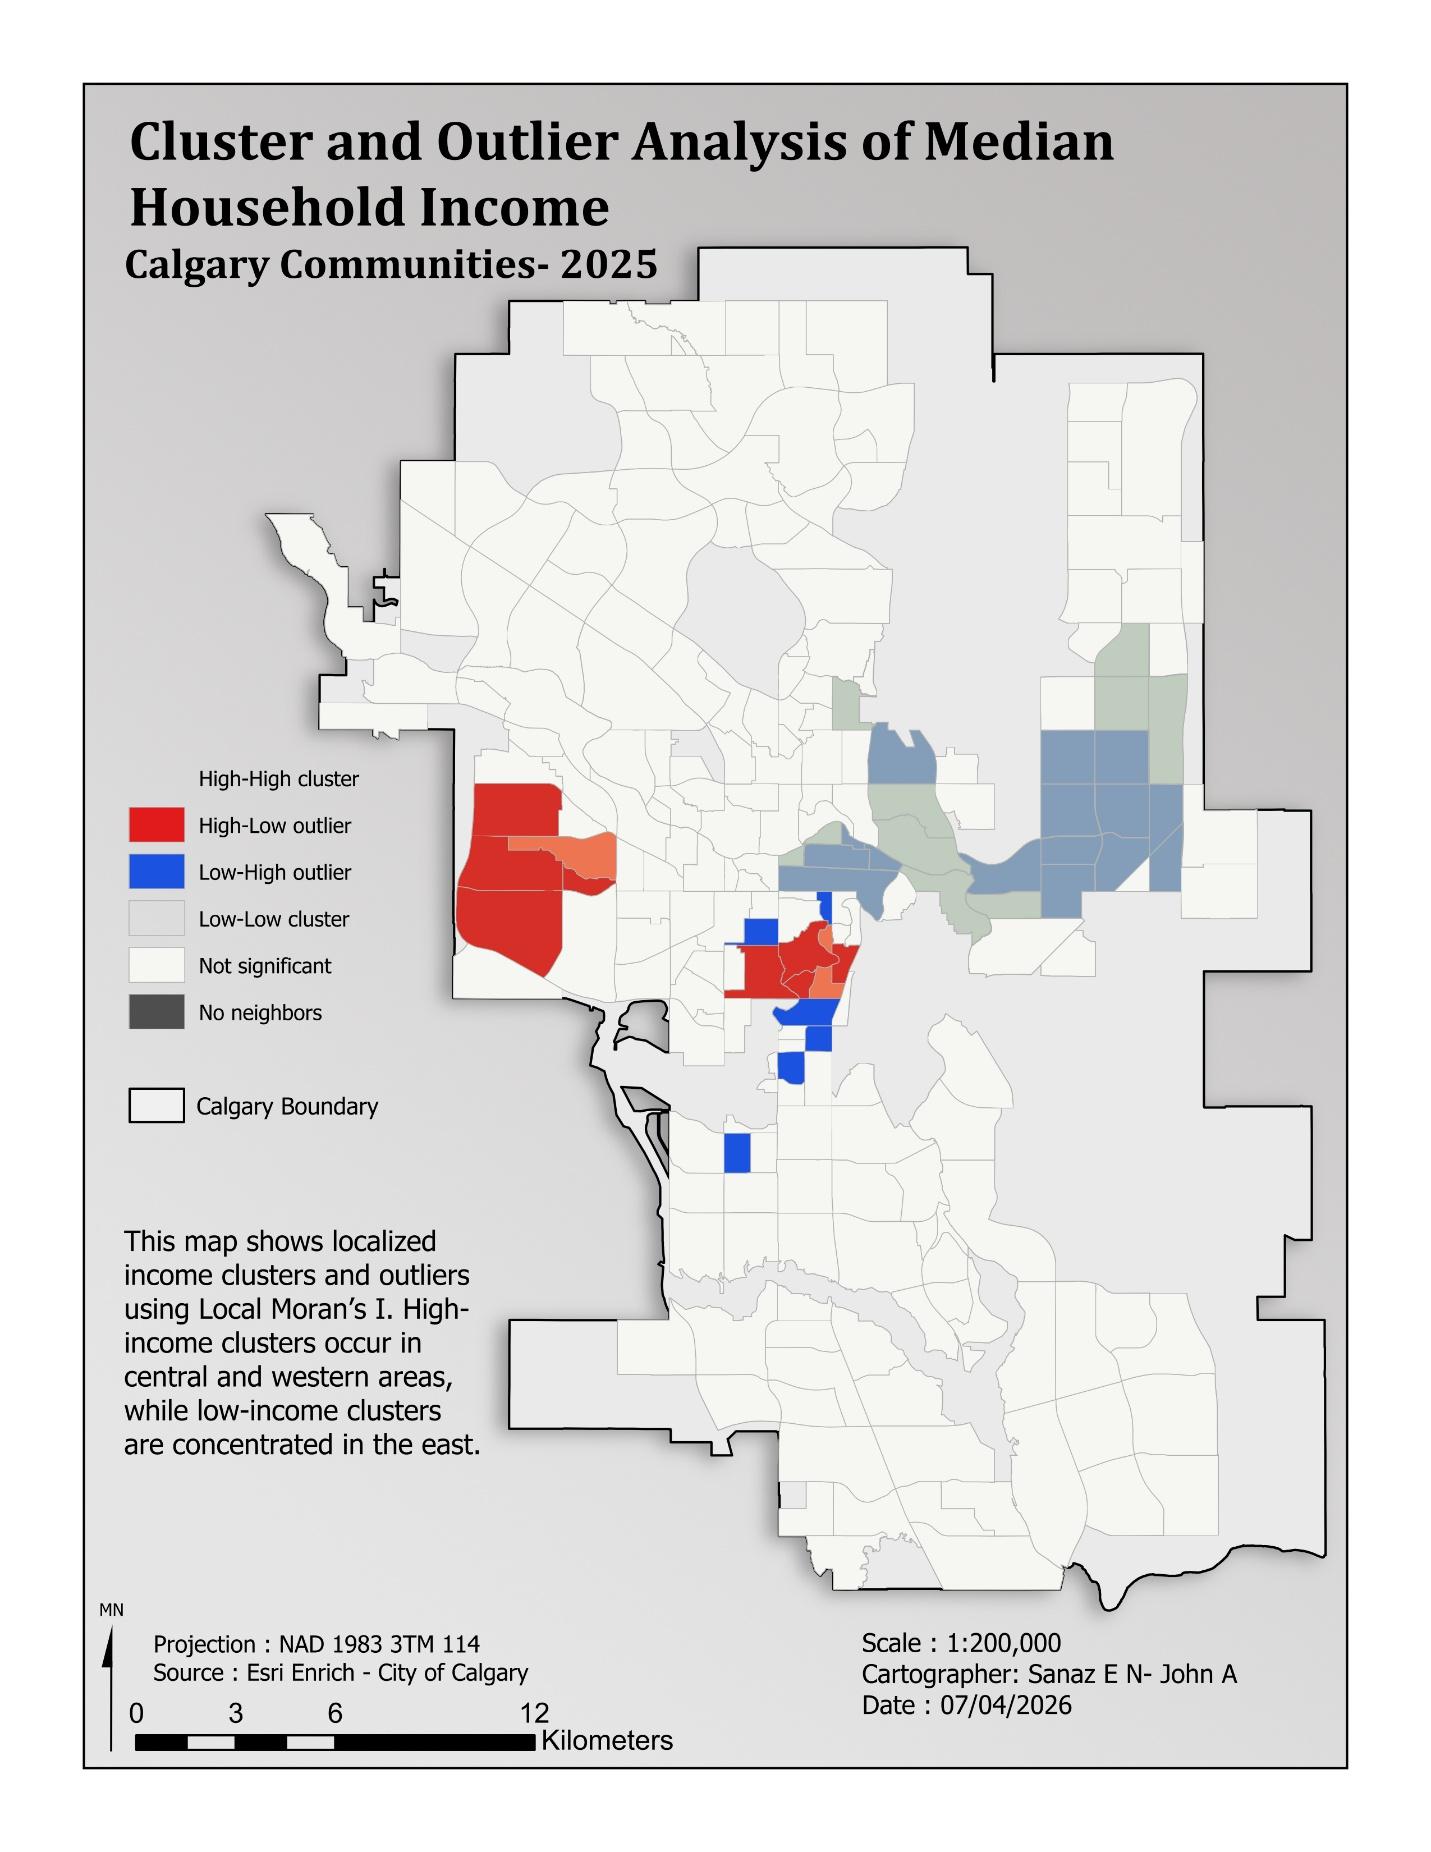
Cluster and Outlier Analysis — Local Moran’s I
The local analysis identifies high–high and low–low income clusters alongside spatial outliers. It complements hotspot analysis by considering each community’s relationship with its neighbours.
Global Moran’s I
Global Moran’s I assessed the spatial distribution of household income, using contiguity edges-only neighbours and row standardization. The results indicate statistically significant positive spatial autocorrelation. These statistics describe income clustering, rather than the accuracy of the solar suitability model.
| Statistic | Reported value |
|---|---|
| Moran’s Index | 0.276648 |
| Expected Index | −0.004673 |
| Variance | 0.002349 |
| z-score | 5.804277 |
| p-value | 0.000000 (rounded as reported) |
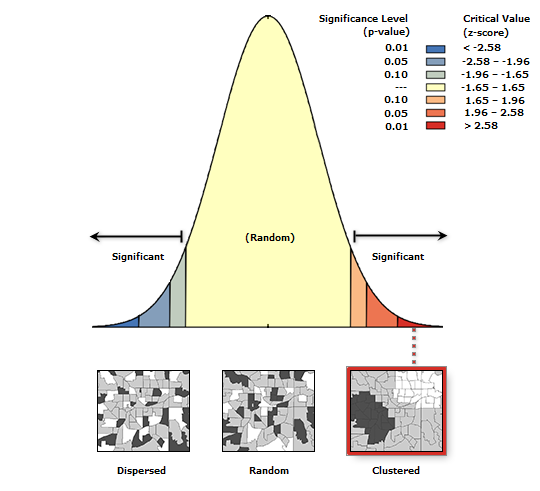
The observed clustering is inconsistent with a random spatial pattern at the significance levels discussed in the report. The reported rounded p-value should not be interpreted as a probability of exactly zero.
06 / PostgreSQL & PostGIS
Database design and spatial SQL
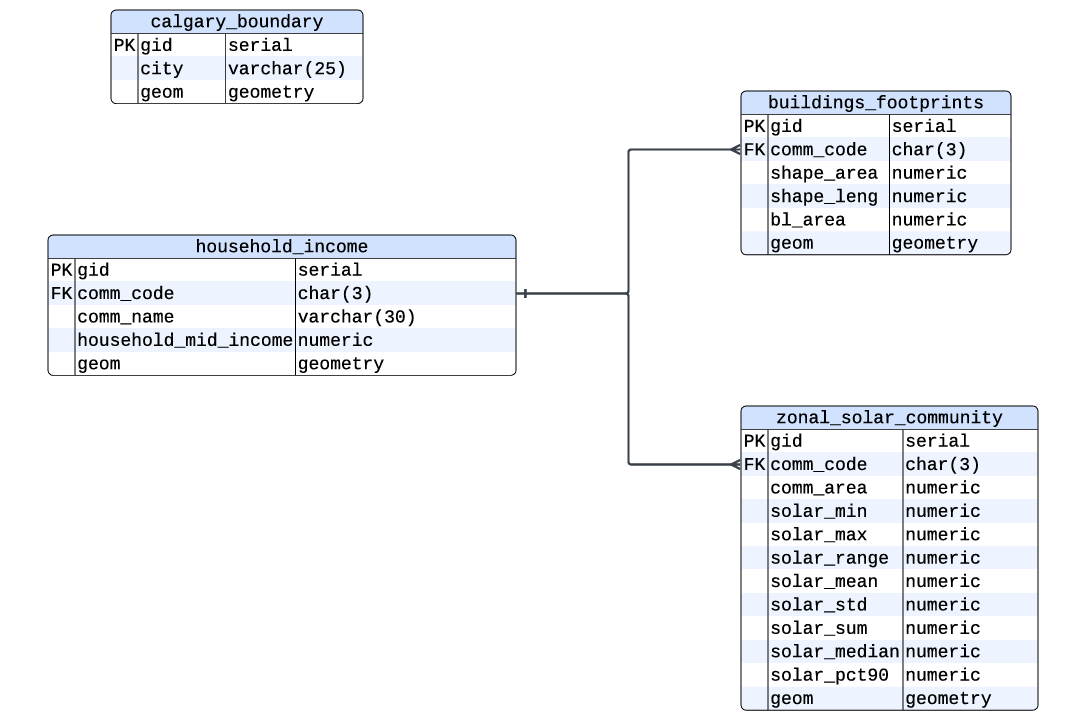
The project replicated its spatial data in PostgreSQL/PostGIS to support relational and spatial analysis alongside ArcGIS Pro. Four core entities — calgary_boundary, household_income, buildings_footprints, and zonal_solar_community — provide city context, community income, rooftop geometries, and solar summaries.
The common comm_code field links community income, buildings, and solar summaries. Geometry columns use the project’s projected reference system, SRID 3776, for area and distance calculations.
SQL code from the report
The following excerpts preserve the SQL as printed in the report. They demonstrate geometry preparation, attribute joins, aggregation, intersection, and energy estimation; they are displayed for review and are not executed by this website.
SQL 01 / PostGIS
Prepare usable residential rooftop geometries
View original SQL excerpt
CREATE TABLE buildings_buffered AS

SELECT

     gid,

     comm_code,

     ST_Buffer(geom, -1) AS geom

FROM buildings_footprints

WHERE building_type = 'Residential'

AND ST_Area(geom) > 2;
SQL 02 / PostGIS
Join community income and solar potential
View original SQL excerpt
SELECT h.comm_name, z.solar_mean

FROM household_income h

JOIN zonal_solar_community z ON h.comm_code = z.comm_code;
SQL 03 / PostGIS
Summarize community income and buildings
View original SQL excerpt
SELECT      h.comm_code, h.comm_name, h.household_mid_income,

     COUNT(b.gid) AS building_count,

     SUM(b.bl_area) AS total_building_area,

     AVG(b.bl_area) AS avg_building_area

FROM household_income h

INNER JOIN buildings_footprints b

     ON h.comm_code = b.comm_code

GROUP BY

     h.comm_code,

     h.comm_name,

     h.household_mid_income

ORDER BY total_building_area DESC;
SQL 04 / PostGIS
Calculate building–community intersection areas
View original SQL excerpt
SELECT b.gid,

          s.comm_code,

          ST_Area(ST_Intersection(b.geom, s.geom)) AS intersect_area

FROM buildings_footprints b

JOIN zonal_solar_community s

ON ST_Intersects(b.geom, s.geom);
SQL 05 / PostGIS
Estimate solar energy production per building
View original SQL excerpt
SELECT b.gid,

b.bl_area,

z.solar_mean,

b.bl_area * z.solar_mean * 0.15 AS estimated_wh_year,

(b.bl_area * z.solar_mean * 0.15) / 1000 AS estimated_kwh_year

FROM buildings_footprints b

JOIN zonal_solar_community z

ON b.comm_code = z.comm_code;
SQL 06 / PostGIS
Create a negative one-metre building buffer
View original SQL excerpt
SELECT comm_code,

          bl_area,

          ST_AREA(ST_Buffer(geom, -1)) AS area_value,

          ST_Buffer(geom, -1) AS buffered_geom

FROM buildings_footprints;
The appendix also includes a separate weighted, min–max SQL ranking example. That example differs from the percentile/geometric-mean method described for the main ArcGIS composite map; the methods are not presented here as interchangeable.
07 / Discussion & conclusion
Supporting informed solar planning
The report concludes that rooftop solar suitability depends on the interaction between environmental resources, available roof area, and socioeconomic capacity. The composite and bivariate maps identify communities where these conditions align, while also showing where financial barriers may constrain adoption despite useful technical potential.
This is a community-scale planning framework. It supports identifying areas for further assessment and considering targeted incentives; it does not establish engineering feasibility for individual roofs or predict actual household adoption.
08 / Interactive StoryMap
Explore the solar study
Follow the project’s maps and narrative in ArcGIS StoryMaps.
Open Calgary Solar StoryMap